Early in the COVID-19 pandemic there was much wishful, and perhaps to some degree magical thinking crying out that COVID-19 is “no worse than Flu!” Sadly and defying all logic and science, the cry remains prevalent today.
For those that care about numbers a recent pre-print article looks at the experience at one tertiary care center and compares several months of COVID-19 with five, count em’, five years of influenza patients. Bear in mind that this study has yet to undergo peer review but given the straight-forward nature of the comparative data I think it unlikely the results will change after publication.
Beth-Israel Deaconess Hospital in Boston looked closely at their COVID-19 patients who were admitted in March and April of 2020 and compared various metrics like ventilator use, vasopressor support (medications that keep heart output and blood pressure from dropping to fatal levels), renal replacement therapy (e.g. dialysis), ICU admission rate and death rate to influenza-positive patients who had been admitted over the previous five years.
From 2014-2019 there were 1052 patients admitted with Influenza. Compare that to 583 COVID-19 positive patients admitted in just the first two months of the pandemic. The average number of flu patients admitted over the typical 8 month season was 210, a total rapidly outstripped by the COVID-19 pandemic. The likelihood of requiring mechanical ventilation for flu patients was 8%, but the likelihood of being placed on a ventilator for patients with COVID-19-related respiratory failure was 31%. Over two months of 2020 174 COVID-19 patients were placed on ventilators compared with a total of only 84 influenza patients over the previous five years combined! The mortality for Influenza patients over the study’s five years was 3% compared with a 20% mortality for COVID-19 patients. Importantly, the percentage of patients without a pre-existing condition was higher for COVID-19 patients (20%) than for Influenza patients (4%) indicating that COVID-19 affects more healthy people than does Influenza.
I’ve posted a number of articles that get to this scientific truth–COVID-19 is more severe and more fatal than influenza. Unless I find particularly compelling data or an ingenious study, I’ll probably not post more on this topic; the data is in and COVID-19 is demonstrably more severe than the flu. Even with overwhelming evidence though, some, plagued by confirmation biases, will continue be data-denialists. They are not new; they have been with us throughout history and sadly they won’t convinced any time soon. You can’t after all, reason a person out of a position they weren’t reasoned into in the first place. To those who value data, this will come as an expected support for a growing mountain of data on COVID-19’s disease burden. The data doesn’t scare us, it informs us and with knowledge, free of dogma or preconceived notions, we will win the war against this very significant threat to human health.
In a study released this week in the New England Journal of Medicine (NEJM) researchers in Europe examined 7 lungs from patients who died of COVID-19, 7 lungs of patients with acute respiratory distress syndrome from influenza A (H1N1) and 10 age-matched non-infected control lungs. They examined the lungs using a variety of tools including immunohistochemical analysis, computed tomographic (CT) imaging, and electron microscopy, and measurements of genetic expression among other modalities.
Patients with COVID-19 and influenza can develop a condition known as acute respiratory distress syndrome (ARDS). ARDS is a very severe pulmonary condition that generally leads to worsening blood oxygenation (hypoxemia) that doesn’t respond well to oxygen and often results in patients requiring mechanical ventilation to survive. On x-ray, patients with ARDS can have a ground glass appearance and lung fields can show increasing consolidation to the point of near complete opacification of the x-ray. Histologically, the alveoli (air sacks in the lungs) are diffusely damaged and edematous (filled with protein containing fluid) often with hemorrhage (bleeding) and fibrin deposition (a marker for inflammation and coagulation).
The researchers set out to compare the lungs of patients with ARDS from influenza A to those with ARDS from COVID-19. There were some similarities. In general patients with ARDS from COVID-19 and influenza A had diffuse alveolar damage and edema but the edema in the influenza patients was more massive and correlated with the lungs of deceased patients with influenza weighing more than those who died of COVID-19. Both sets of patients had immune cells though there was some difference in the types of T-cells. With respect to measures of inflammation-related gene expression, COVID-19 patients had a total of 79 inflammation-related genes expressed but only 2 genes were uniquely differentially regulated in patients with influenza. The two groups shared an expression pattern for 7 genes.
Significant differences started to arise when the researchers looked at thrombosis and blood vessel pathology. The alveolar capillaries (very small blood vessels where gas exchange of oxygen and carbon dioxide occurs) were 9 times more likely to have microthrombi (small blood clots) and occluded small blood vessels in COVID-19. Additionally, the endothelium (cells that make up the walls of the blood vessels) and endothelial cell membranes of the COVID-19 patients showed significantly more damage from virus present within the cells than similar cells in influenza infected lungs. Finally and most surprisingly, from all of this vascular damage done by SARS-CoV-2 to the lungs of patients with COVID-19, there was significant angiogenesis (development of new blood vessels) in COVID-19 lungs. The combination of increased blood vessel cell damage and microclotting in patients with COVID-19 may be responsible for the lungs working overtime to create new blood vessels to compensate.
This study is small and because of that there could be other reasons for the differences seen between the two groups and the authors concede this. But these findings fit with the experiences of clinicians and researchers who report much higher frequency of clotting abnormalities and dramatic levels of inflammatory response in COVID-19 patients. It’s unknown if the angiogenesis has any effect on survivability either way–further studies may help to elucidate this question.
COVID-19 death counts and accusations that they have been inflated is a topic I’ve avoided writing about because it’s politically charged. When something becomes political these days it moves away from the realm of science and into the realm of dogma, or quasi-religion. That’s why I shun politics. How do you rationally and logically discuss something that contradicts an almost religiously-held political belief? It’s like trying to convince someone that your religion is far superior to theirs and that all their theological ideas and canon are wrong. No good can come from it. This is the state of politics in America. In spite of this and against my better judgement I’m going to tackle the highly politicized issue of death counts because it’s that important.
Much of this started when Dr. Scott Jensen, who also happens to be a Republican State Senator in Minnesota, claimed on Fox News that doctors were being encouraged by CDC death certificate guidelines to list COVID-19 as a diagnosis even when there’s no clear evidence of COVID-19 infection. He went on to suggest that there was a financial motivation to list COVID-19 as a diagnosis because Medicare pays $13,000 for a COVID-19 and $39,000 if that same patient is placed on a ventilator. He also stated that doctors have a different approach when caring for patients with influenza. He used a hypothetical case of a patient with influenza who died during the course of the illness with a pneumonia as well. For him that death would be due to respiratory failure and pneumonia.
Jensen gave a hypothetical example of a patient who died while suffering from influenza. If the patient was elderly and had symptoms like fever and cough a few days before passing away, the doctor explained, he would have listed “respiratory arrest” as the primary cause of death.
“I’ve never been encouraged to [notate ‘influenza’],” he said. “I would probably write ‘respiratory arrest’ to be the top line, and the underlying cause of this disease would be pneumonia … I might well put emphysema or congestive heart failure, but I would never put influenza down as the underlying cause of death and yet that’s what we are being asked to do here.”
Dr. Scott Jensen/Fox News
Dr. Jensen and others have also called into question a CARES Act provision that pays hospitals a 20% bump over Medicare payments for patients with COVID-19. With financial incentives like this the clear implication is that doctors and hospitals are cooking the books, in effect, to unethically profit off of the crisis. There also seems to be a growing sentiment that above and beyond financial interests, that COVID-19 deaths are inflated in order to damage the President and increase the likelihood that he will lose the general election in November.
There’s a lot to unpack here but I’ll do my best. As always, I’m going to do my best to steer clear of politics and just try to address the accusations. For me, the most important reason to answer the allegations because of the damage they unfairly do to the public’s trust of doctors, hospitals and public health system. I’ll briefly discuss Dr. Jensen’s claims and why they don’t make sense to me. Ultimately you may choose to believe him over me but know that I don’t have a financial interest in COVID-19. On the contrary, as long as this crisis disrupts the economy my family is taking a financial hit like so many other American households. Life will unquestionably be better for me when this is over; I have no desire to make it seem worse than it is or drag it out longer than needed. I do have a great desire to help people understand how truly dangerous this virus is which is a different thing altogether. After I address Dr. Jensen, I will provide some data that I think shows pretty clearly that numbers aren’t exaggerated, in all likelihood COVID-19 deaths are undercounted.
Let’s take a look at the claim that hospitals get $13,000 for a COVID-19 admission and $39,000 for ventilation of a patient with the same diagnosis. These numbers are pretty close to the truth but what Dr. Jensen didn’t mention is that they are taken from the same diagnosis-related group (DRG) that covers other similar respiratory conditions. The Kaiser Family Foundation found that “average Medicare payment for respiratory infections and inflammations with major comorbidities or complications in 2017, which was $13,297.” They also found that “the average Medicare payment for a respiratory system diagnosis with ventilator support for greater than 96 hours…was $40,218.” So the base payment for hospitalization and/or ventilation for COVID-19 is actually pretty much identical to the payment for similar respiratory conditions. Well, what about the 20% bump you might ask? It is definitely true that this bump exists; it is part of the CARES Act that Congress passed and the President signed to help get the country through the crisis. The 20% bump is designed to help hospitals cover the added costs of caring for COVID-19 patients including personal protective equipment, isolation and disinfecting costs, and in particular the cost of caring for the uninsured. By paying a bit more for every Medicare patient, hospitals are better able to handle the added costs of caring for patients who have no insurance and likely will never be able to fully pay for their care assuming they survive to try.
As far as Dr. Jensen’s accusation of pressure to list COVID-19 on death certificates I’d also argue that the CDC’s guidance on certifying COVID-19 deaths is not unreasonable. This is based on my experience as a physician and public health doctor during the crisis. I definitely don’t think that this is resulting in a statistically significant over-counting of COVID-19 but more on that later in the post. Here’s the CDC’s exact wording.
In cases where a definite diagnosis of COVID-19 cannot be made, but it is suspected or likely (e.g., the circumstances are compelling within a reasonable degree of certainty), it is acceptable to report COVID–19 on a death certificate as “probable” or “presumed.” in these instances, certifiers should use their best clinical judgement in determining if a COVID–19 infection was likely. However, please note that testing for COVID–19 should be conducted whenever possible.
Guidance for Certifying Deaths Due to Coronavirus Disease 2019 (COVID–19)
You don’t have to believe me on this but this practice is not unusual for certification of death. There has never been a cookbook method of listing causes of death. For patients with infectious diseases, high suspicion based on clinical presentation and exposure history can inform decisions about cause of death even in the absence of laboratory tests. I fully disagree with Dr. Jensen on one of his points. He suggested in his Fox News interview that he never codes a patient who has tested positive for influenza as an influenza death if the patient has pneumonia. He reports he would list that death as respiratory failure and pneumonia. I do not believe that is the practice of the majority of US physicians nor do I believe it is appropriate. For patients such as this, the acute illness with influenza, should at least be included as a secondary diagnosis as it certainly contributed to the patient’s death.
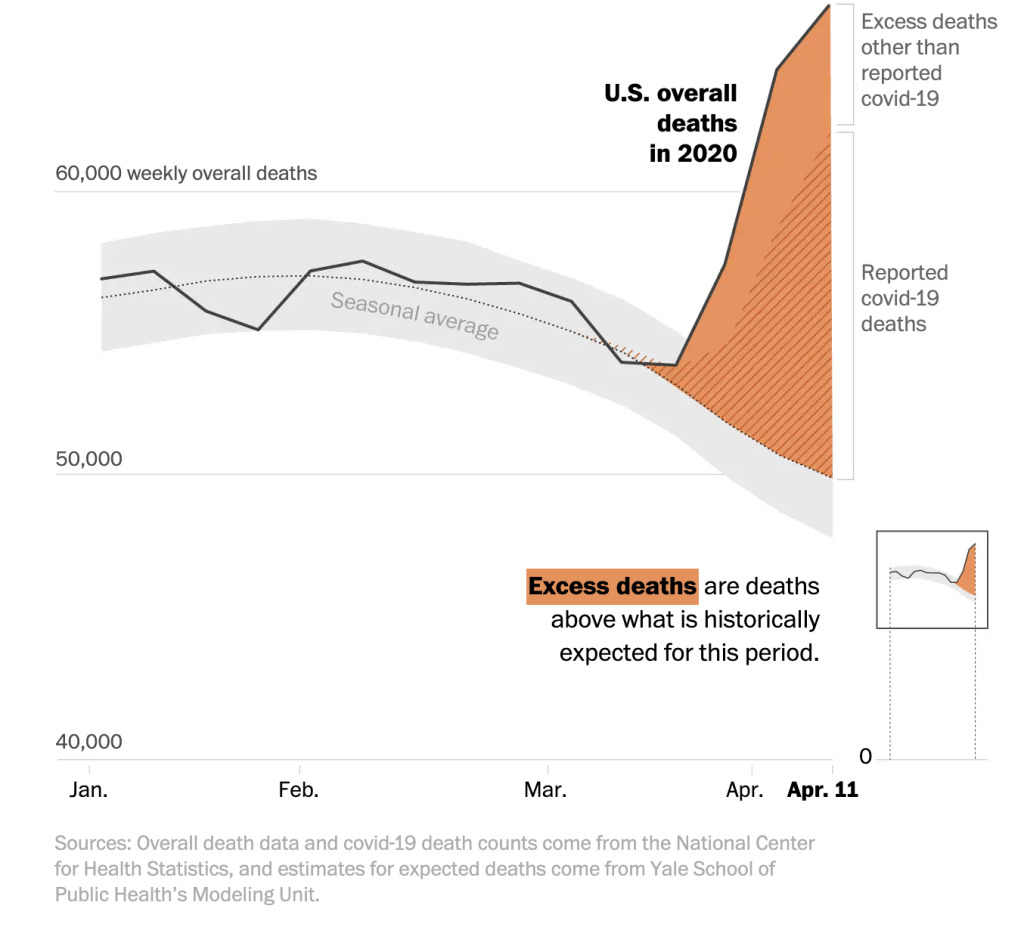
So enough about Dr. Jensen. Let’s take a look at the data that to me shows that deaths are indeed real and not over-counted. The data shows they are actually significantly undercounted. The New York Times has been tracking year to year differences in deaths in seven states with some interesting results. When compared to the previous five years New York City for instance had 225% more deaths (11,900) this year between March 8 and April 11 than the same period for the last five years–no year came anywhere close. The rest of New York had 42% (4200) more deaths than previous years and New Jersey had 72% (5200) more. Other states showed the same trend: Michigan had 21% (2000), Illinois came in at 13% (1400) and Massachusetts was higher by 20% (1200). Where did these deaths come from if not COVID-19? Did we suddenly have large aberrant spike in trauma deaths or cardiac deaths or cancer deaths in multiple states this spring? I think it would test the bounds of credulity to suggest this is the case. The truth is, I think, simpler; this spring we were hit with a dangerous virus that can hide in seemingly healthy people and spread easily to close contacts causing a disturbingly common severe respiratory distress syndrome with or without multisystem organ failure.
Excess U.S. deaths Hit Estimated 37,100 in Pandemic’s Early Days, Far More than Previously Known/Washington Post
If that’s not enough, consider this. In all of the states I mentioned and that the Times followed, the number of confirmed COVID-19 deaths is lower than the total number of extra deaths. In other words, COVID-19 deaths were undercounted in NYC (1700), NJ (3000), NY State (1700), Michigan (600), Illinois (700) and Massachusetts (500) over that time period. The Washington Post looked at the early days of the pandemic and measured excess deaths across the country and found similar data–we had far more deaths than normal years and there’s solid evidence that we didn’t catch all of the COVID-19 cases.
I can understand that some Americans may have doubts about COVID-19 numbers, particularly when physicians step forward to suggest that something fishy is going on. It’s reasonable to feel this way and it’s important to hear out critics of any system. I don’t believe Dr. Jensen is lying and I don’t believe he is a bad person. He’s undoubtedly an excellent, dedicated doctor to the patients in his practice. I think just think he’s wrong about this and in my mind the data confirms this.
Governor Newsom announced the start of Phase II of California’s COVID-19 response today by allowing limited pick-up service openings for businesses like book stores, sporting goods stores, and florists as early as this coming Friday. This is a measured loosening of restrictions to be sure as there’s no real congregating allowed and this is probably the most that could safely be undertaken at this point. We have not met several of the criteria outlined by infectious disease experts for safe relaxation of stay-at-home orders. In particular, while testing is increasing, we are not at the level where comprehensive evaluation of any symptomatic person can be achieved with results on the same day or within hours. Additionally, it’s not clear that daily new cases are declining let alone for 14 days straight, another of the primary relaxation criteria. Given this, it’s a bit of a risk to begin loosening of restrictions at this point but I’m guessing he hopes allowing these relatively safe activities will help put an end to the incredibly risky behavior of protesters around the state in recent days. Some experts like Dr. Robert Kim-Farley from UCLA are predicting that Phase III which will include the opening of higher risk businesses like movie theaters and gyms might occur sometime in the late summer, possibly August or September. Timelines like this are notoriously difficult to predict however, since they sometimes depend on non-medical decision making by political leaders. I wouldn’t be shocked to see that timeline bumped up somewhat.
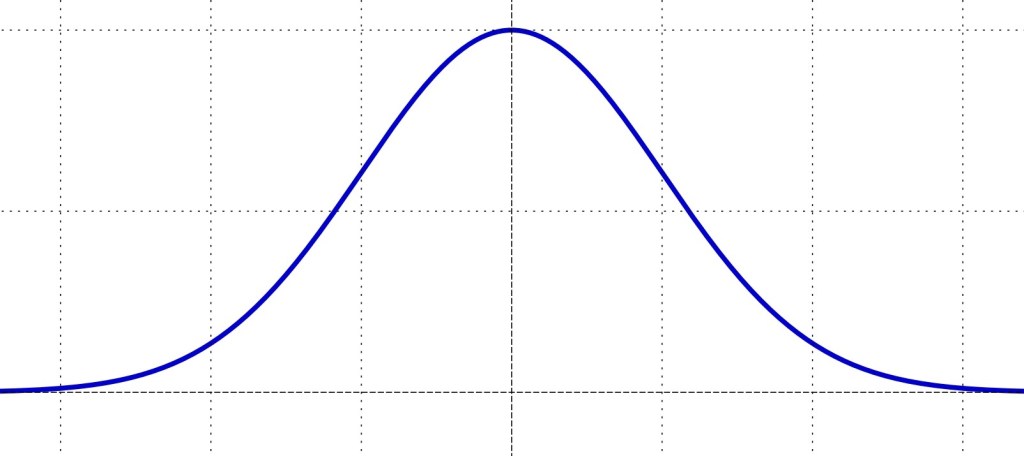
It seems pretty clear now that the United States’ COVID-19 disease course is not following a Gaussian curve with an equal slope on the way up to and down from the peak. Instead the disease is declining at a much slower rate than when it ramped up to the peak. This slow tapering recovery will unfortunately lead to significantly more cases and deaths from the initial disease surge than predicted by models that assume a Gaussian distribution as there will ultimately be more area under the curve.
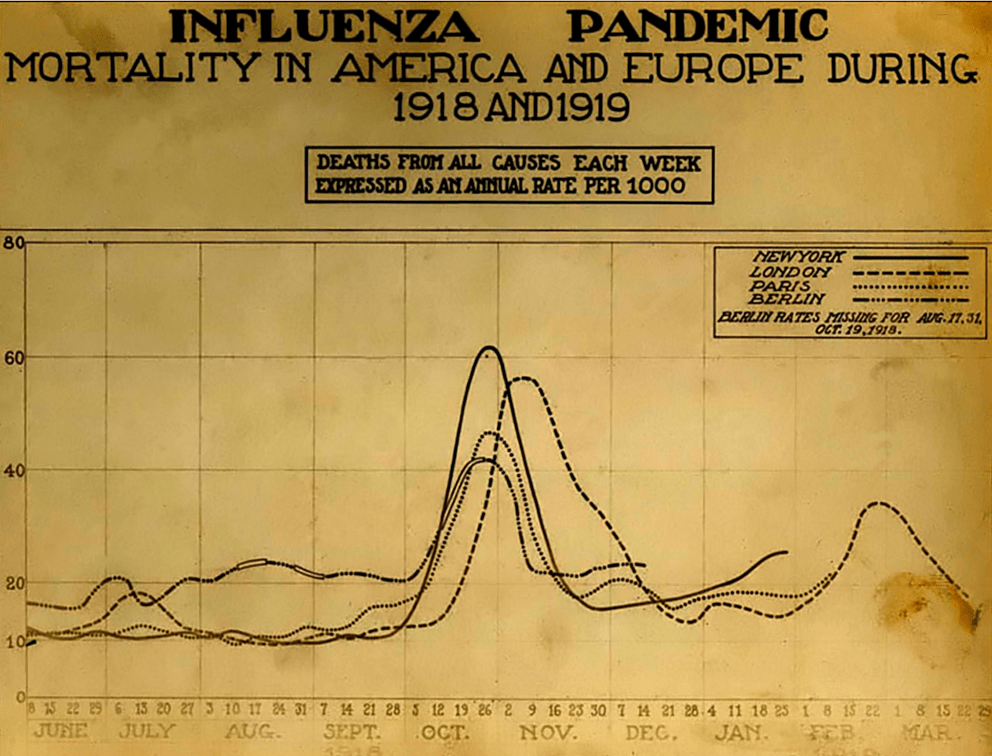
Michael Osterholm, a foremost expert on viruses and pandemics who many people saw for the first time on Joe Rogan’s podcast is the Director of the Center for Infectious Disease Research and Policy (CIDRAP). Last week his group at CIDRAP released a report that describes three possible pandemic wave scenarios based on lessons learned from previous pandemics. The first scenario sees one to two years of recurring peaks and valleys similar to what we’ve just experienced requiring periodic reinstitution of mitigation measures like we’re currently living under. For obvious reasons, this scenario could have dramatic economic repercussions. The second scenario mimics the 1918 influenza pandemic which saw an initial peak in the spring and a massive, much more devastating peak in the fall after relaxation of social distancing measures during the summer. This second peak would almost certainly overwhelm our healthcare system and lead to very large numbers of deaths but would not be followed by significant peaks after the fall peak as the virus would have burned through most of the population. The third scenario describes a slow burn after the current, initial surge. In this scenario there are no peaks and valleys, just a constant relatively stable number of ongoing cases and deaths. This scenario would not require large-scale mitigation measures after the initial peak. While this pattern has not been seen with previous influenza pandemics it could occur with a novel coronavirus such as SARS-CoV-2/COVID-19. Whatever scenario plays out, the CIDRAP group advises that Americans should get used to the idea of significant COVID-19 activity for the next 18-24 months. As the pandemic starts to fade away, it’s likely that SARS-CoV-2 will continue to cause less and less severe illness over the next decade eventually settling in as a non-life threatening upper respiratory infection much like it’s other cold-causing coronavirus cousins.
Understanding the difference in deaths due to flu and deaths due to COVID-19 requires an understanding of how the CDC calculates flu deaths annually. Flu is dramatically underreported each year. Some of the reasons for that undercounting include a fairly narrow window for detecting the virus through testing (i.e. even if a patient has flu, the test may not detect the virus if the test is done outside of the window for testing), the fact that older patients who die from flu may never even be tested, and even if tested and positive, death certificates may list associated pneumonia instead of flu as the cause of death.
In order to adjust for this gross undercounting, the CDC uses algorithms based of of actual positives recorded each year in the FluSurv-Net influenza surveillance system to retroactively estimate total numbers of deaths from flu. They start by adjusting the influenza confirmed test-positive hospital deaths to account for under-detection (reasons stated above like false negatives) to arrive at an estimate of influenza hospital deaths. Because not everyone with influenza dies in the hospital, they then look at death certificates to reach a determination of deaths due to influenza that occurred outside of the hospital. They assess multiple causes of death like pneumonia and other respiratory causes and compare those ratios with the actual deaths related to influenza from the FluSurv-Net surveillance system to reach a total disease burden and estimated annual deaths. This is all done retrospectively so data for the current year is generally not available for some time.
This method of determining influenza burden has clear benefits. It’s important for Americans and healthcare workers to understand the cost in lost lives from influenza each year. Because virtually all of us have someone we love who is considered high risk for death from influenza, maintaining high vaccination rates are critical to preventing dramatic increases in deaths. But in a year with COVID-19, this estimated death toll from influenza is problematic and has led some pundits, elected officials and millions of google-trained virologists and epidemiologists to erroneously conclude that COVID-19 is no worse than flu and that a shutdown was/is unnecessary. This, however, is not a valid comparison as no similar algorithm for missed COVID-19 cases is in play. Only actual test-positive COVID-19 cases are counted with a few very specific exceptions.
In an interesting opinion piece in Scientific American, ER physician Dr. Jeremy Faust of Brigham and Women’s and Harvard Medical School suggested that this false comparison and the damage it does to understanding the scope and severity of COVID-19 may necessitate that the CDC move to reporting only test-positive cases of influenza. When Dr. Faust compared the confirmed flu deaths from each of the last seven years with the confirmed COVID-19 deaths of 2020, a clearer picture of COVID-19’s severity became clear.
This year alone, confirmed COVID-19 deaths are nearly 10 times higher than confirmed flu deaths. Dr. Faust also looked deaths for just one week of COVID-19 and compared those deaths to the previous seven seasons of flu.
If we compare, for instance, the number of people who died in the United States from COVID-19 in the second full week of April to the number of people who died from influenza during the worst week of the past seven flu seasons (as reported to the CDC), we find that the novel coronavirus killed between 9.5 and 44 times more people than seasonal flu. In other words, the coronavirus is not anything like the flu: It is much, much worse.
Jeremy Faust, MD/Scientific American
Changing the way we report flu deaths by listing only test-confirmed cases could have serious adverse consequences when it comes to influenza vaccination rates. If Americans see the smaller totals and think that confirmed flu cases are an accurate representation of flu burden they may be less likely to vaccinate. That could have a devastating effect on protecting vulnerable populations from flu in future seasons. Still, during this COVID-19 crisis the apples to oranges comparison of COVID-19 deaths to annual flu deaths has led many Americans to erroneously and dangerously conclude that COVID-19 is no worse than flu. It’s vital that Americans understand the substantial difference and maintain vigilance against COVID-19, evidenced by the extremely unwise increase in mass anti-lockdown protests popping up around the country. As Dr. Faust suggests, the CDC should consider modifying its flu reporting to at least include data for test-confirmed cases with their algorithmic estimates of influenza burden.