Categories
COVID-19

State of The Disunion

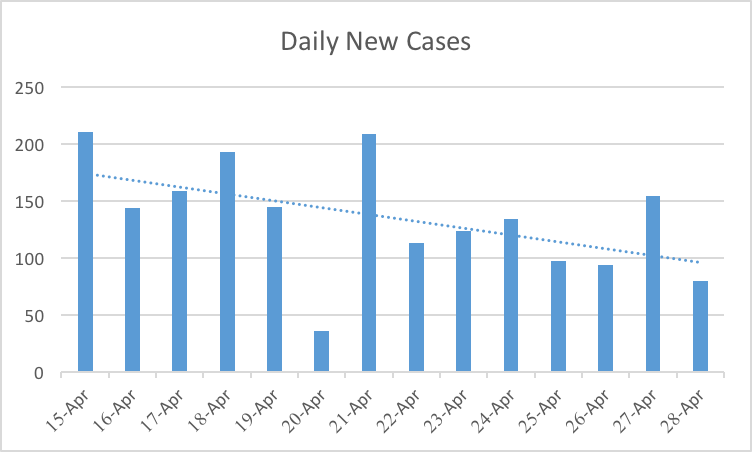
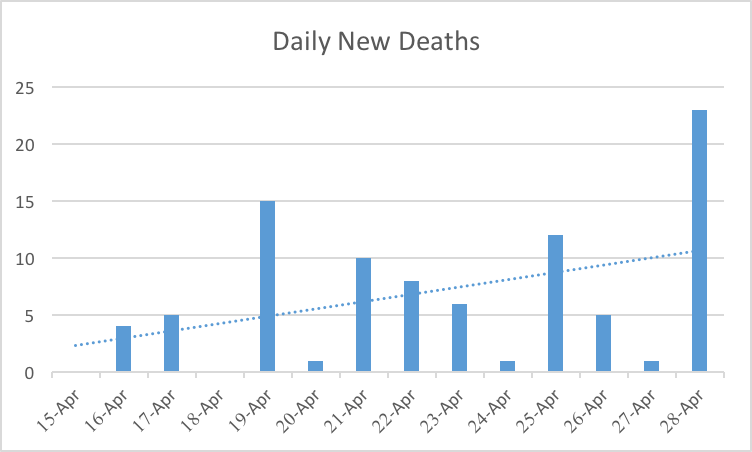
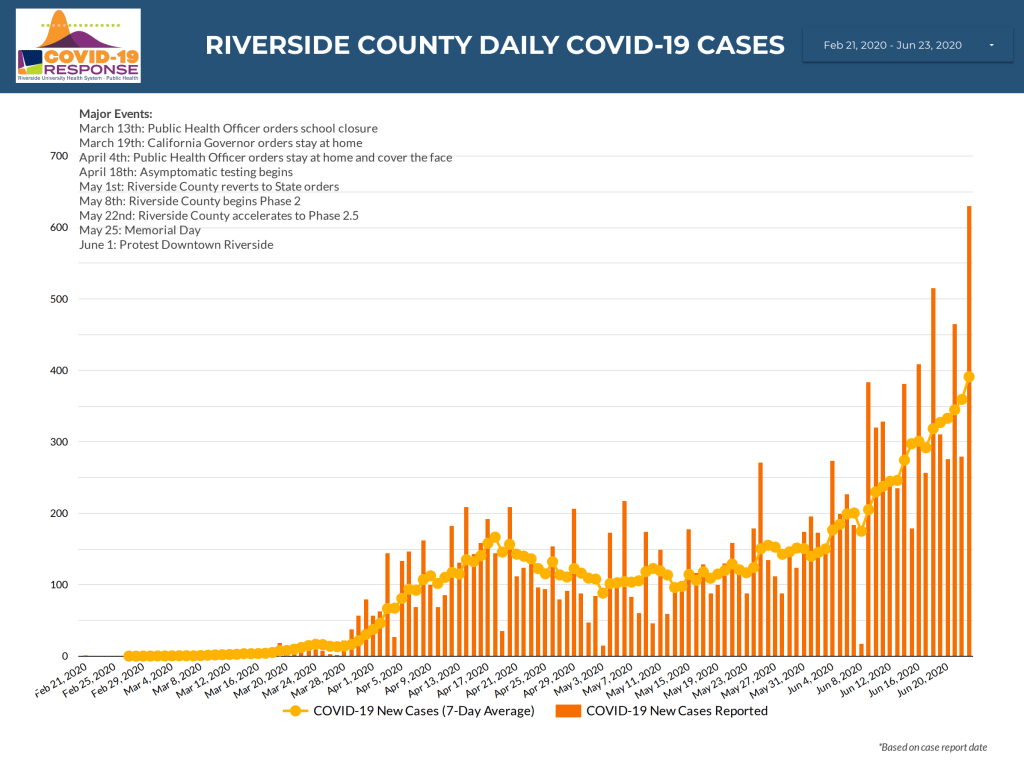
A look today at how we’re doing with COVID-19. First let’s look at my home region, Riverside County. Like much of the country Riverside is seeing significant increases in new daily cases. Over the last week or so we’ve been seeing over 500 new cases each day on most days. Yesterday, Riverside saw its highest daily increase yet with 631 new cases in 24 hours. That compares to fewer than 100 cases per day on most days in mid-April after the initial surge and when social distancing orders were in place. Other metrics are moving in the wrong direction as well: hospitalizations and ICU admits are up but still manageable, the percent-positive rate is up, and doubling-time (time it takes for cases to double) is down. The doubling time maxed out at around 33 days in Riverside a few weeks ago but has now slipped to around 28 days. This is perhaps the most worrisome signal that we’re losing control of the virus in this region. If this trend continues we’ll edge closer and closer to the risk of exponential growth we faced at the beginning of the pandemic. A discussion of exponential growth is beyond the scope of today’s post but at the bottom I’ll post a video of an excellent and understandable explanation of exponential growth and why it isn’t intuitive for most people. The percent-positive rate (rate at which Riverside County’s COVID-19 tests are coming back positive) is at 10%. This is up from a low of around 5 in early May. What this indicates is that our increase in cases is not merely due to increased testing as some political leaders suggest but in fact a true representation of increased prevalence of the virus in the community. Hospitalization rates are an important factor to watch. Daily new cases can be affected by testing rate and the reporting of daily new cases often lags behind as reporting may be slower from sone agencies. Rising hospitalizations show in real-time how a region is doing because it’s a measure of how many people are quite sick, now. Keep an eye on hospitalizations. More people don’t get sick enough to be hospitalized because we test more, more people get really sick because there’s more infection out there.

RUHS Coronavirus/https://www.rivcoph.org/coronavirus

What about the rest of the country? We’re seeing increasing cases in a number of hotspots around the country. The New York Times tracks where the virus is increasing and we’re seeing significant increases in several hotspots around the country.

NY Times map showing areas with increasing numbers of cases of COVID-19

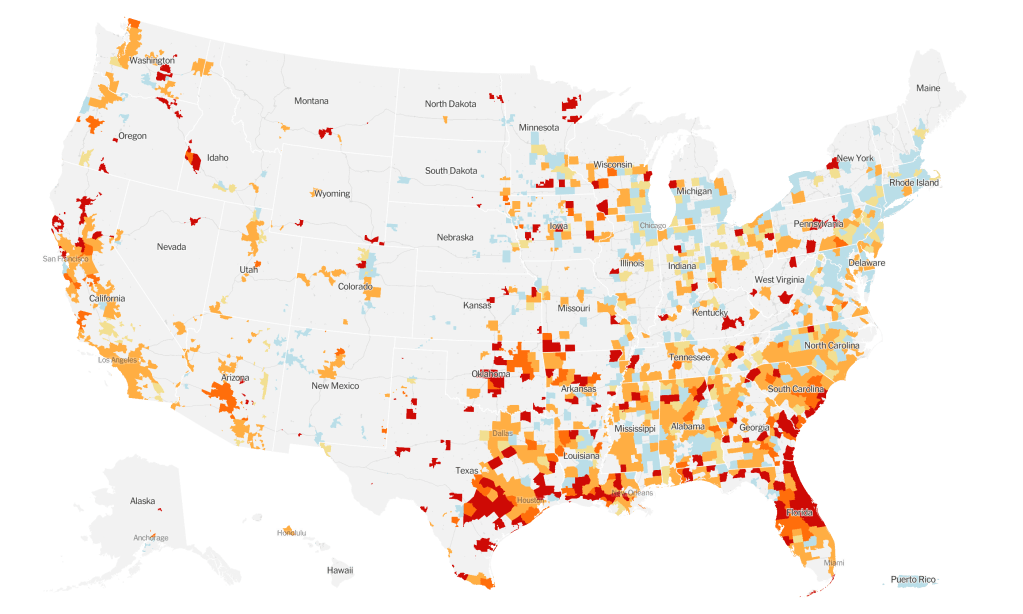
The South was the first region to begin reopening after stay-at-home orders and they’re now the region with some of the most noticeable growth in the last two weeks with 10 states in the region on an increasing trajectory including Texas, Florida, Georgia, North Carolina, Louisiana, Tennessee, Alabama, South Carolina, Mississippi, Arkansas and Oklahoma. Overall, the most concerning regions in the country right now are Florida (reopening began May 4), Arizona (reopening began May 8), Texas (reopening began April 30) and Oklahoma (reopening began April 24). Florida had an 86% increase in new cases over one week and a doubling of their percent-positive rate to 11% in recent days. According to the Sun Sentinel, 75% of adult ICU beds in South Florida are now occupied. The state has had to walk back some of its reopening to address the rising cases there. Arizona has seen their percent-positive rate leap to 20% with an increase in new cases of 90% in a one week period. Oklahoma saw the biggest one week increase with a jump of 111% in new cases. Texas has seen similar increases in percent-positive rate (now at 10%) and new cases (up 86% in a week). More worrisomely, Texas has seen a 60% increase in new hospitalizations. NPR reports that Texas Children’s Hospital in Houston is now admitting adults with COVID-19 to help with the surge, this in spite of the fact that Houston is home to Texas Medical Center, the largest hospital in the world. The growth of the virus in Texas has led some regions within the state to begin mandating facial coverings and Governor Greg Abbot to implore the state’s residents to do so to help keep business open.

“Wearing a mask will help us to keep Texas open.”

Texas Governor Greg Abbott

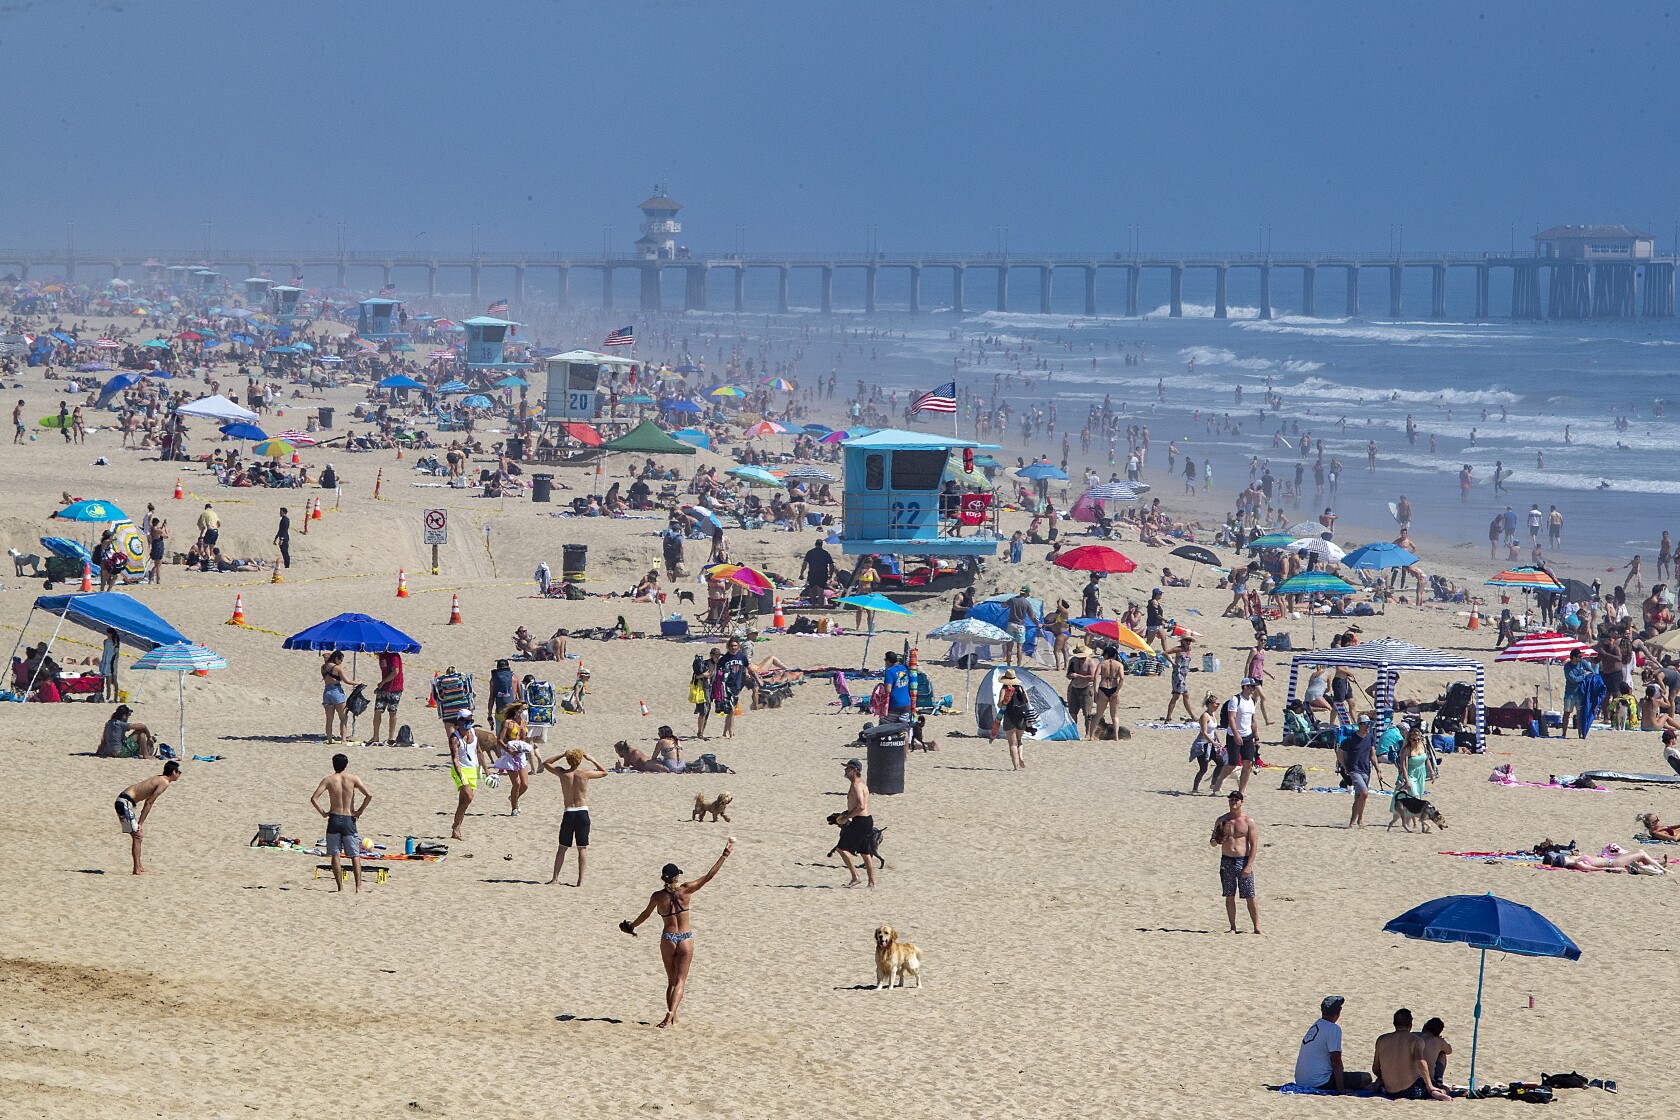
States that reopened early are not the only states of concern right now and certainly other factors contribute to surges in a region like the recent protests and outbreaks at inpatient institutions. But there are some simple facts that seem to be lost on a significant percentage of Americans: SARS-CoV-2 is here, it’s a dangerous virus that can spread exponentially through an almost completely vulnerable population and no amount of hiding our collective heads in the sand about these previous two facts is going to make it go away. Perhaps the simplest and most effective thing Americans could do to prevent the spread would be to wear a mask when in indoor public spaces and outdoors when social distancing isn’t possible. If the majority of Americans wore a face covering under these circumstances, the spread of SARS-CoV-2 would be significantly limited and businesses would be much less at risk of new closures. As I discussed in a previous post, wearing a mask isn’t for your own protection. The science on masks shows us that if the majority of a population wears face coverings, we, the wearers, spread the virus to fewer people. Wearing a mask protects your neighbor, particularly the most vulnerable, it isn’t to protect you. Your neighbor wears a mask to protect you. If more of us do it, we protect more people. So let’s be neighborly and wear a mask to keep the economy open by stopping the exponential spread of COVID-19, which is starting to happen…again.


Here’s the video that nicely and understandably explains the math of exponential growth.

Categories
COVID-19

Has Riverside County Finally Passed Its COVID-19 Peak

A brief look this morning at some data where I live. Here are some of the data for Riverside County since April 15

Daily New Cases

Daily New Deaths

So looking at a population like Riverside County can be challenging compared to larger centers around the country. There will inevitably be variations in the graphs because of a relatively smaller population and regional reporting characteristics.

What you probably can see is that there appears to be an overall decline in Daily New Cases in Riverside over the last several weeks. Most days in the last week are running under 100 new cases. It’s a general trend and there’s a lot of noise here so it’s difficult to draw any solid conclusions. One thing to note is the odd reporting on April 20. That day there were problems with the State’s data entry tool, CalREDIE. The 22nd made up for that when the system was working better but it’s probably more accurate to average those two days to something more like 122 and 123.

Similarly there appear to be changes in Daily New Deaths, the difference being an increase more recently. Again, all the caveats about sample size and variation are applicable here so we probably need to watch the data a bit longer to know for sure that the trends are true. But an increasing Daily New Death rate with a decreasing Daily New Case rate does tell us something. It’s possible that we’re at or maybe a bit past our peak for this wave of the infection in Riverside County. Typically, the deaths start to go up after peak which makes sense. If you have an increased number of people going into the hospital over a few days, they don’t generally die right away but within a week or two those that are most severe will die–hence, tragically deaths go up even though cases are going down. Further data over the next several weeks will likely tell us one way or the other. I’ll post updates in future days but keep an eye on those numbers. The easiest way to do that I’ve found is STAT’s COVID-19 tracker. You can view down to county level on this tool to monitor Daily New Cases and Daily New Deaths.

One other bit of news for Riverside before I go is that our doubling time has increased to 13 days! That starts to bring us in line with the State which is good news! I remember when we were doubling every 4.6 days and we (public health) longed for a doubling time in the double digits. Seems like a lifetime ago, I think it was a month.

Categories
COVID-19

Thoughts on COVID-19 from a New Home

For some time I’ve been considering leaving Facebook. While there are many positive aspects of the social media giant, there are some things about it that I find hard to stomach. It’s a great place to share photos of family and pets and jiu jitsu, but it’s a terrible place for conversations. The world is polarized and so is Facebook, actually, the world may be polarized because of Facebook. I love to talk science though. Writing about COVID-19, while not a cheery subject, has helped me process some of the feelings I have about living through it, especially as a public health physician, worried father and husband. I just want to do it more on my terms. No yelling, no anti-science comments, just people who want to understand what on earth is happening right now with the best tool the human race has ever devised for understanding our world. So welcome to my new home!

Thoughts on COVID-19

  • Nationally there’s a bit of a worrisome trend with our doubling time. A while back, on Facebook, I mentioned the good news that our national doubling time was increasing and that it was increasing by more than a day, every day. That signifies a peak in terms of new daily cases. The daily increase in doubling time was actually increasing along a sloping curve meaning something approximating an accelerating growth curve. That’s not happening anymore. What we see now is more of a plateauing of our doubling time. It’s been stuck increasing at a rate of about 18-20 hours a day for a week or so–every day our doubling time is increasing by the same amount, 18-20 hours. It’s no longer accelerating. There are a couple reasons for why that might be happening. Some are okay, some are not. It’s possible that regional and state differences in the timing and slope of the COVID-19 curves are making it so that later peaking states are rising while earlier peaking states are waning. That could be okay. It just means we’re all marching to the beat of our own drums and eventually we’ll all start a collective increase in our doubling time rate together. It also could mean that people are slipping with their social distancing and stay-at-home compliance. Spread of infection during recent protests along with religious ceremonies for Easter and Passover could be putting the brakes on our ride away from the peak. More time will tell. For all sorts of great information on the national doubling time, visit https://www.danreichart.com/covid19 He runs one of my favorite statistical sites for COVID-19 and most of my US doubling time information posted to Facebook and now here comes from his great work. His approach is to look at each day anew. Here’s where we are today and this is what we’ll look like in the future if our doubling time stays what it is today.
  • And now some pretty good news. Scientists from the the Jenner Institute at Oxford have been working on a vaccine. What makes this good news is that it’s a vaccine they made some time ago as a possible vaccine for MERS and they’ve already tested it for safety–last year actually. Safety testing can be one of the longest steps in the process of making a good vaccine. You have to watch people for quite a while to make sure they don’t have any lingering adverse effects–sometimes several years. Having something ready to test for efficacy is a big head-start. The vaccine has recently been tested in rhesus macaque monkeys with good results. Six monkeys were given the vaccine and then exposed to a large amount of the virus. All six are still healthy a month out. Testing in monkeys doesn’t guarantee success in humans but the rhesus macaque is just about the closest thing we have to humans. Given that, testing in humans is likely to happen sooner rather than later. If all goes well (that’s a gigantic IF), and the Institute is given emergency approval, they could have several million doses available as early as September. That would be monumental. Please remember there are still massive efficacy hurdles to jump so take a deep breath and in a very unscientific way, maybe cross your fingers.
  • With this pandemic, the rush to find an effective treatment has been fully understandable. I posted early about the possibility that hydroxychloroquine might be an effective treatment based on some very small, and it turns out pretty flawed, studies. Newer (also small, also not peer reviewed) studies out of Brazil and the VA system in the US indicate that hydroxychloroquine is ineffective in the treatment of COVID-19 and possibly dangerous (the trial in Brazil was stopped when some of the patients in the high-dose arm of the study developed lethal cardiac arrhythmias). The efficacy and safety of hydroxychloroquine to treat COVID-19 should be established in large, controlled studies and it should not be provided as an off-label treatment for the virus in a non-study setting. There, I said it. Good science takes time and patience. But nobody’s listening to me.
  • Look to hear from California’s Governor Newsom sometime in the next 48 hours regarding details about relaxation of the stay-at-home/social distancing orders. California’s actions have made a difference. As we’ve known for a century at least, social distancing works and it worked here. While the initial orders were emergent and broad-sweeping, look for the relaxation orders to be more surgical and to come with a period of evaluation. We needed quick, blanket action to prevent massive spread of the virus through the entire population of California when it was doubling every two days. With a doubling time of two days, the virus would have hit everyone in America within about 40 days. Now that we’re much more under control we can relax elements of social distancing one at a time with a period of observation to look for spikes. We can then see which of these measures were the most important in preventing spread of this virus. This process will give us valuable data and will help us in the fall when it’s likely the virus will surge again. Our break from the lockdown may not be as soon as we’d hoped though. This past weekend, some Californians jumped the gun and flocked to the beaches in numbers that are simply unwise at this point. This was a mistake and may very well lead to an uptick in the virus within the next two weeks. It’s just simple virology. If that happens we may not get our relaxation phase as soon as we would have, had people maintained social distancing per state and local public health department orders. Here’s hoping we don’t see that or that what we see isn’t enough to derail our break from the lockdown.
Allen J. Schaben/Los Angeles Times