Just how many Americans have been exposed to COVID-19 is a difficult number to know with absolute certainty but each day we get closer and closer as serological (antibodies to the virus present in the blood) studies begin to roll in. Many Americans drastically overestimate this number, perhaps as some form of wishful thinking. Current best estimates from ongoing serological studies from the CDC and others puts the positivity rate somewhere around 10% or less nationwide with some regions higher and some lower based on regional disease prevalence to date. Current deaths due to COVID-19 stand at just over 214,000. To obtain herd immunity for COVID-19 we need to reach, at a minimum, 70% of Americans infected. With 214,000 deaths after the first 10% of Americans infected we could expect another one million deaths or more before herd immunity would have any significant protective effect. Even if our ability to treat patients improves enough over time to cut the death rate in half we’d see an additional half a million deaths from a do-nothing approach to the pandemic.
COVID-19 denialists hold that deaths due to COVID-19 are over-counted. A few weeks ago they gleefully pointed to a CDC report which revealed that 94% of reported deaths were in people with other health issues. To them, this apparently indicated that only 6% of people had actually died from COVID-19. I’m not going to address the fallacy of that thinking here other than to say that if I have diabetes and while crossing the road I get struck by a bus and die, my cause of death is blunt force trauma–pure and simple. We can’t say that diabetes killed me in this case even if my diabetes made my treatment more difficult and played some role in my demise. Diabetes may very well be listed on my death report; I still died from blunt force trauma. The clearest evidence that denialists are wrong here comes from an examination of excess deaths. Epidemiologist can easily examine the previous five or ten years of deaths to establish a predicted number of deaths for the current year. In 2020, as of mid-September, there were 278,000 excess deaths compared with previous years. At that time (September 19, 2020) there were 199,000 deaths attributed to COVID-19. There are two important points here that invalidate the unscientific thinking of COVID-19 denialists in several ways. First, an accounting of excess deaths isn’t an examination of cause of death. It’s simply this: let’s count deaths from the last few years and then let’s count deaths from this year. Guess what, the number this year is bigger…by quite a bit. Where did all those excess deaths come from? It didn’t come from the soul-crushing inability to go to the gym or a favorite nail salon; it came from people dying after being infected with a novel coronavirus. The second important point form this data is that the evidence points to the fact that we’re undercounting COVID-19 deaths. As of September, there have been 278,000 excess deaths but only 199,000 (currently 214,000) deaths reported as due to COVID-19. That means there are nearly 80,000 extra deaths this year that very likely the majority of those were uncounted COVID-19 deaths.
A report from the CDC shows that Arizona’s institution of mandatory masks significantly reduced transmission of COVID-19 within 2 weeks. A combination of mask mandates and other mitigation strategies (prohibiting large gatherings, temporary closure of bars, gyms and theaters and a reduction in restaurant capacity led to a 75% decline in COVID-19 transmission statewide.
The number of COVID-19 cases stabilized and began to decrease approximately 2 weeks after local officials began mandating mask wearing (throughout several counties and cities) and enhanced sanitation practices
A massive study out of India looking at COVID-19 transmission dynamics is well worth reading. I’m going to focus on two important points from the study in part because of their timeliness. First, the study showed that not all spreaders are equal. Approximately 70% of infected individuals did not demonstrate spread to other contacts. Instead, 8% of positive index cases were responsible for nearly two thirds of contact cases. This supports the growing evidence that super-spreading events such as the White House Rose Garden SCOTUS event play an extremely import role in disease spread and underscores the importance of social distancing, mask wear and restricting large groups. The second point I want to highlight from the Indian study shows that children spread the virus at similar rates as seen in adults. The study was unable to examine spread from children to adults but it did show that infected children spread the disease to 18% of their peers. This of course has significant implications for the reopening of schools across the country. As I’ve stated before, to safely reopen schools disease prevalence in the overall community must be very low and testing must be widespread with quick results to allow for rapid isolation of positives and contacts and comprehensive contact tracing. This kind of low community rate comes from grown-ups strictly adhering to non-pharmaceutical interventions such as but not limited to full adherence to mask-wearing and the avoidance of congregating in group settings.
Early in the COVID-19 pandemic there was much wishful, and perhaps to some degree magical thinking crying out that COVID-19 is “no worse than Flu!” Sadly and defying all logic and science, the cry remains prevalent today.
For those that care about numbers a recent pre-print article looks at the experience at one tertiary care center and compares several months of COVID-19 with five, count em’, five years of influenza patients. Bear in mind that this study has yet to undergo peer review but given the straight-forward nature of the comparative data I think it unlikely the results will change after publication.
Beth-Israel Deaconess Hospital in Boston looked closely at their COVID-19 patients who were admitted in March and April of 2020 and compared various metrics like ventilator use, vasopressor support (medications that keep heart output and blood pressure from dropping to fatal levels), renal replacement therapy (e.g. dialysis), ICU admission rate and death rate to influenza-positive patients who had been admitted over the previous five years.
From 2014-2019 there were 1052 patients admitted with Influenza. Compare that to 583 COVID-19 positive patients admitted in just the first two months of the pandemic. The average number of flu patients admitted over the typical 8 month season was 210, a total rapidly outstripped by the COVID-19 pandemic. The likelihood of requiring mechanical ventilation for flu patients was 8%, but the likelihood of being placed on a ventilator for patients with COVID-19-related respiratory failure was 31%. Over two months of 2020 174 COVID-19 patients were placed on ventilators compared with a total of only 84 influenza patients over the previous five years combined! The mortality for Influenza patients over the study’s five years was 3% compared with a 20% mortality for COVID-19 patients. Importantly, the percentage of patients without a pre-existing condition was higher for COVID-19 patients (20%) than for Influenza patients (4%) indicating that COVID-19 affects more healthy people than does Influenza.
I’ve posted a number of articles that get to this scientific truth–COVID-19 is more severe and more fatal than influenza. Unless I find particularly compelling data or an ingenious study, I’ll probably not post more on this topic; the data is in and COVID-19 is demonstrably more severe than the flu. Even with overwhelming evidence though, some, plagued by confirmation biases, will continue be data-denialists. They are not new; they have been with us throughout history and sadly they won’t convinced any time soon. You can’t after all, reason a person out of a position they weren’t reasoned into in the first place. To those who value data, this will come as an expected support for a growing mountain of data on COVID-19’s disease burden. The data doesn’t scare us, it informs us and with knowledge, free of dogma or preconceived notions, we will win the war against this very significant threat to human health.
A look today at how we’re doing with COVID-19. First let’s look at my home region, Riverside County. Like much of the country Riverside is seeing significant increases in new daily cases. Over the last week or so we’ve been seeing over 500 new cases each day on most days. Yesterday, Riverside saw its highest daily increase yet with 631 new cases in 24 hours. That compares to fewer than 100 cases per day on most days in mid-April after the initial surge and when social distancing orders were in place. Other metrics are moving in the wrong direction as well: hospitalizations and ICU admits are up but still manageable, the percent-positive rate is up, and doubling-time (time it takes for cases to double) is down. The doubling time maxed out at around 33 days in Riverside a few weeks ago but has now slipped to around 28 days. This is perhaps the most worrisome signal that we’re losing control of the virus in this region. If this trend continues we’ll edge closer and closer to the risk of exponential growth we faced at the beginning of the pandemic. A discussion of exponential growth is beyond the scope of today’s post but at the bottom I’ll post a video of an excellent and understandable explanation of exponential growth and why it isn’t intuitive for most people. The percent-positive rate (rate at which Riverside County’s COVID-19 tests are coming back positive) is at 10%. This is up from a low of around 5 in early May. What this indicates is that our increase in cases is not merely due to increased testing as some political leaders suggest but in fact a true representation of increased prevalence of the virus in the community. Hospitalization rates are an important factor to watch. Daily new cases can be affected by testing rate and the reporting of daily new cases often lags behind as reporting may be slower from sone agencies. Rising hospitalizations show in real-time how a region is doing because it’s a measure of how many people are quite sick, now. Keep an eye on hospitalizations. More people don’t get sick enough to be hospitalized because we test more, more people get really sick because there’s more infection out there.
What about the rest of the country? We’re seeing increasing cases in a number of hotspots around the country. The New York Times tracks where the virus is increasing and we’re seeing significant increases in several hotspots around the country.
NY Times map showing areas with increasing numbers of cases of COVID-19
The South was the first region to begin reopening after stay-at-home orders and they’re now the region with some of the most noticeable growth in the last two weeks with 10 states in the region on an increasing trajectory including Texas, Florida, Georgia, North Carolina, Louisiana, Tennessee, Alabama, South Carolina, Mississippi, Arkansas and Oklahoma. Overall, the most concerning regions in the country right now are Florida (reopening began May 4), Arizona (reopening began May 8), Texas (reopening began April 30) and Oklahoma (reopening began April 24). Florida had an 86% increase in new cases over one week and a doubling of their percent-positive rate to 11% in recent days. According to the Sun Sentinel, 75% of adult ICU beds in South Florida are now occupied. The state has had to walk back some of its reopening to address the rising cases there. Arizona has seen their percent-positive rate leap to 20% with an increase in new cases of 90% in a one week period. Oklahoma saw the biggest one week increase with a jump of 111% in new cases. Texas has seen similar increases in percent-positive rate (now at 10%) and new cases (up 86% in a week). More worrisomely, Texas has seen a 60% increase in new hospitalizations. NPR reports that Texas Children’s Hospital in Houston is now admitting adults with COVID-19 to help with the surge, this in spite of the fact that Houston is home to Texas Medical Center, the largest hospital in the world. The growth of the virus in Texas has led some regions within the state to begin mandating facial coverings and Governor Greg Abbot to implore the state’s residents to do so to help keep business open.
“Wearing a mask will help us to keep Texas open.”
Texas Governor Greg Abbott
States that reopened early are not the only states of concern right now and certainly other factors contribute to surges in a region like the recent protests and outbreaks at inpatient institutions. But there are some simple facts that seem to be lost on a significant percentage of Americans: SARS-CoV-2 is here, it’s a dangerous virus that can spread exponentially through an almost completely vulnerable population and no amount of hiding our collective heads in the sand about these previous two facts is going to make it go away. Perhaps the simplest and most effective thing Americans could do to prevent the spread would be to wear a mask when in indoor public spaces and outdoors when social distancing isn’t possible. If the majority of Americans wore a face covering under these circumstances, the spread of SARS-CoV-2 would be significantly limited and businesses would be much less at risk of new closures. As I discussed in a previous post, wearing a mask isn’t for your own protection. The science on masks shows us that if the majority of a population wears face coverings, we, the wearers, spread the virus to fewer people. Wearing a mask protects your neighbor, particularly the most vulnerable, it isn’t to protect you. Your neighbor wears a mask to protect you. If more of us do it, we protect more people. So let’s be neighborly and wear a mask to keep the economy open by stopping the exponential spread of COVID-19, which is starting to happen…again.
Here’s the video that nicely and understandably explains the math of exponential growth.
A brief note today on some big COVID-19 news. Researchers from Oxford have announced that they plan to publish very exciting results from a large trial examining potential treatments for COVID-19. They have shown that dexamethasone (Decadron) reduced mortality by one third (28% vs 40%) when given to patients requiring ventilatory support and by 20% (20% vs 25%) for slightly less severe patients who require only oxygen for support. The study included over 2000 patients receiving dexamethasone and compared them to over 4000 patients recieving standard care. It’s likely that the benefit of dexamethasone comes from reducing the body’s inflammatory overreaction to the virus that affects some people with COVID-19 and can lead to multi-organ failure and death. It did not benefit less severe patients, those who don’t require help with breathing, and in those cases giving dexamethasone may prolong the period of viral shedding. So please don’t rush out and put yourself on dexamethasone as many did with hydroxychloroquine. As always, we’d do better if we listened to experts rather than assume knowledge we don’t have because we saw something on the internet.
This is an incredibly important result for a couple of reasons. First, it’s the only drug to date to demonstrate that it saves lives. Remdesivir if you recall, shortens hospital stays and hastens recovery but the data did not reveal that it reduced mortality. Second, dexamethasone is a cheap steroid well known in the medical community to reduce inflammation. The cost of treating someone for 10 days with dexamethasone and saving their life could be as little as $50.
Dropping mortality from 40% to 28% doesn’t sound remarkable but given the scope of this infection and the number of deaths it translates into very tangible improvements in outcome. In the UK for instance, where this study is based, had the medication been given to patients from the start of the pandemic it would have saved 5000 lives.
It’s been a time of great unrest in the Unites States and around the world after the death of George Floyd in Minneapolis at the hands of several police officers there. Demonstrations continue to occur around the country. Unquestionably we’ll see some disease surges in cities where protests occurred. Some factors that could lead to a greater surge include the use of tear gas and pepper spray which induce violent coughing, a significant driver of disease spread. Additionally, pepper spray and tear gas cause respiratory epithelial damage which could make protesters more susceptible. We know from sporting events like the UEFA Champion’s League match in Milan on February 19 between between Atalanta and Valencia that the gathering of thousands of screaming people can lead to devastating super-spreading events. Two days after that match Italy had its first case and epidemiologists feel that the match likely played a part in the region’s massive outbreak. Similarly, the protests saw much yelling likely introducing more virus into the air and onto surfaces. A mitigating factor of course, is that almost all protests occurred outdoors where dissipation of virus containing droplets occurs much faster than the still air inside buildings. We’ll likely start to see increasing cases in the next week as spikes generally occur 2-3 weeks after spreading events. Admittedly though, since there’s already a significant increase occurring in many localities due to reopening measures it may be hard to tease out causative factors.
There’s a bit of a notion that COVID-19 is merely a disease of the very old. While this disease unquestionably hits older ages disproportionately, the death toll for people pre-retirement age and younger is not insignificant. In the US, 19% of all deaths have occurred in ages 64 and below for a total of 36,906 deaths at the time of this writing. COVID-19’s disease burden is not limited to retirees and the risk to older, pre-retirement workers is substantial. This has impacts beyond death rates. The disease often leads to a long period of illness and potentially long hospitalizations. Having a significant number of employed individuals hospitalized and/or sick for extended periods of time has a measurable effect on the economy. Dismissing this disease as merely a disease of the very old is not just statistically wrong, it’s unwise on many levels for the wellbeing of the nation.
CDC Data for US COVID-19 Deaths by Age/CDC
A MMRW Early Release publication looked at how the US Air Force managed over 10,000 trainees and limited total COVID-19 cases to 5 with only 3 transmissions. Their success is no surprise to public health experts as it followed well established non-pharmaceutical interventions. Trainees were kept healthy utilizing arrival quarantine, social distancing, mandatory face coverings and rapid identification of exposed/infected individuals through rapid testing and contact tracing. As the disease grew around the country, recruits from heavily infected areas were not permitted onto the base for training. The success there indicates clearly that well-established public health interventions like those described above can very successfully prevent viral spread and can allow for business almost as usual. Just because it can’t be said too much–wear a face covering!!
The FDA rescinded its Emergency Use Authorization for hydroxychloroquine today after reviewing the growing data demonstrating that the medication is ineffective in the treatment of COVID-19 and carries significant cardiac risk. There are still a few large trials underway examining the medication’s usefulness and safety but the FDA’s action means the medication now should not be used outside of those trials.
There are over 135 vaccines in development for COVID-19. The most advanced trial (Phase III) is the Oxford University vaccine which is a viral vector vaccine–the spike protein from SARS-CoV-2 is delivered with a safe virus in order to generate an immune response. In the case of the Oxford vaccine that virus is an adenovirus which causes the common cold. Early data indicates that the Oxford vaccine may not prevent SARS-CoV-2 infection but it may prevent fatal illness. Even that would make the vaccine a significant step forward against COVID-19. Right on Oxford’s heels is the Moderna vaccine which is a genetic vaccine (the mechanism was discussed in an earlier post). Moderna expects to have a large scale Phase III trial underway in July. If these vaccines make it through their trials and demonstrate efficacy and safety, it’s possible that emergency use for front-line healthcare workers, first responders and highest risk individuals may be possible in late 2020. So much has to line up for that to be a reality I hesitate to mention it for fear of raising hopes too much. But it’s always nice to end on an optimistic note so here’s to hope!
A few days ago, the WHO’s technical lead on COVID-19 Maria Van Kerkhove, caused quite a kerfuffle by suggesting that infected, asymptomatic people with COVID-19 very rarely spread the infection. The WHO and Dr. Van Kerkhove fairly quickly walked back those comments but not before her words raced through the internet and caused heated discussion everywhere.I thought it worth digging into a bit. What is the current science on asymptomatic spread?
First it’s important to understand that asymptomatic can mean at least two things with respect to COVID-19 and I think this is where some of the confusion arose with Dr. Van Kerkhove’s remarks. The first type of asymptomatic patient is the one who is infected and will never get sick with COVID-19. The second is the person who is infected, has not YET shown symptoms of the disease but will eventually become sick. We know a lot more about the second person than we do about the first. The second person is probably better described as pre-symptomatic. Studies indicate that the incubation period for COVID-19 is probably between 2 and 14 days with the average being 5 days. Studies largely out of Asia indicate that pre-symptomatic spread during those 5 days (2-14 days) almost certainly occurs enough to be a significant driver of the disease. Likewise, the a study from April confirmed that viral spread can occur well before symptoms and is likely responsible for up to 44% of secondary case infections. Overall, the data seems to clearly point to pre-symptomatic spread being an important factor in COVID-19 disease worldwide.
The amount of spread from truly asymptomatic individuals, those that never display signs or symptoms of the disease, is less well known but is likely to be less of a factor than for symptomatic and pre-symptomatic people. One preprint study (not yet peer reviewed) out of Australia attempts to quantify the percentage of individuals with COVID-19 who are asymptomatic and found from reviewing over 900 studies that this number is likely around 15%. Of all those studies only four looked at the forward transmission of virus from asymptomatic individuals and hand sufficient numbers of participants to draw conclusions. Those papers found that the rate of transmission ranged from 0-2.2% suggesting that asymptomatic spread occurs quite rarely.
Another study, however, out of Scripps published in the last week looked at specific closed cohorts from around the world (USS Theodore Roosevelt, Diamond Princess, Rutgers University Students, various nursing facilities and prisons to name a few) to examine the rates of asymptomatic spread. Three of the cohorts (from Iceland and Indiana) had representative samples of the population so they represent a better model for estimating true asymptomatic spread. In those cases the researchers found that the asymptomatic rate of infection was 40-45%. Numbers that high clearly indicated that asymptomatic spread could indeed be a very important driver of disease worldwide.
All of these studies have their problems. Many studies looking at asymptomatic spread have too few participants to draw strong conclusions. Others were unable to clearly distinguish between asymptomatic, pre-symptomatic and mildly symptomatic. It is clearly too soon to draw definitive conclusions from these studies or as scientists are wont to say, “more studies are needed.” That’s actually part of what Dr. Van Kerkhove said after discussing the possibility of low asymptomatic transmission rates in her media briefing several days ago but that tends to get lost in stories by the lay-press. When reporters hear a soundbite they know will draw in readers, viewers, listeners and clickers they are excited to report it because they know it’s a hot-button issue. They rarely focus on the cautionary parts of the scientist’s comments because, frankly, they’re a buzz-kill. But science doesn’t work that way. Simply put, it’s too early for us to know the answer to this question. Making policy decisions now with the evidence we have about asymptomatic spread would be utterly foolish. Science is a process that gradually and with methodical verification and re-verification, works slowly but surely closer to understanding the natural world around us.
These nuances are often lost on the lay-press when they report on science and medicine. They’re terrible at it because they want no part of the gray; they want only the black and the white. In the history of science there are only a relatively small handful of topics for which science has gotten anywhere close to the black and the white of it all. Even then, scientists work to reexamine and refine our knowledge of the best understood concepts in science. You can always know more and things can always change, even if incrementally. But when the press reports an informal statement by one very good scientist as potential gospel, only to have to report something different the next day because the first was off the mark, it does nothing but erode the public’s trust in science, medicine and public health.
I urge you to take stories from the lay-press with a gigantic grain of salt. The best studied concepts and theories in science have, in some cases, been examined and reexamined for hundreds of years. We’ve known about SARS-CoV-2 for six months. Think about that. Things will change; our understanding will change. That’s not a fault of science and medicine, the absence of dogma and science’s ability to change is what makes it the best tool humans have ever devised to understand our world and the threats to it.
Early on in the COVID-19 crisis, the US government, CDC and Public Health made an important error. US citizens were told that they should not wear masks. This mistake wasn’t completely without support in the scientific literature. Studies looking at mask-wearing as a way to prevent getting infected with a virus weren’t very convincing. Additionally, there’s evidence that people who wear masks may touch their faces more, a definite risk factor for becoming infected. Mainly though, in the early days we wanted to make sure that masks got to those who need them most–first responders and healthcare workers on the front lines.
It wasn’t very long after, however, before evidence started to mount that the US was looking at masks in the wrong way. Rather than focusing on the mask as protection for the wearer, studies were indicating that wearing a mask protects your neighbors from infection if you’re asymptomatic or presymptomatic. The virus is largely spread through respiratory droplets from coughing, sneezing, talking, singing or yelling. Wearing a mask, even one made from cloth, can be surprisingly efficient at trapping your infected droplets thereby preventing spread to others.
A widely sited recent study by De Kai, Guy-Philippe Goldstein, Alexey Morgunov, Vishal Nangalia, and Anna Rotkirch utilized a dynamic network-based compartmental model and individual agent-based modeling to study how masks can slow the spread of SARS-CoV-2. Compartmental models are a type of computational model that imitates how humans in different groups or “compartments” interact and similarly, agent based modeling follows the course of a disease through an individual or “agent” and tracks that agent’s interactions throughout the group or community. They’re fancy, they’re really cool and I have to admit they’re largely beyond me. This group of computational researchers, however, showed with these models that the spread of SARS-CoV-2 is significantly reduced when 80% of the population is compliant with mask-wearing in public by about day 50 of the pandemic. Their models also found that the response was nominal and basically unhelpful when only 50% of the public complies or if populations don’t start wearing masks in time. Similar to herd immunity from vaccination, in order to reap the benefits of masking and stop the spread of SARS-CoV-2, a significant majority of the population has to commit to complying in order to protect the larger community. When compliance slips we see viral outbreaks. If you’d like to better understand their methods, take a look at the author’s fascinating and compelling explanatory video.
To further examine the results of their modeling, the researchers compared them to real-world examples. They contrasted the response to the virus in countries and regions that adopted the practice of mask-wearing early and comprehensively with countries that don’t encourage or mandate universal mask-wearing. The correlations they found supporting their computational modeling were considerable. Countries and regions like Macau, Beijing, Shanghai, Hong Kong and Taiwan who made universal masking mandatory early saw a dramatic reduction of the disease from their peak and they generally avoided large-scale, strict lockdowns. On the other hand, countries with late or poor mask compliance demonstrated meager reduction of disease from peak even with the enactment of strict lockdowns.
De Kai, Guy-Philippe Goldstein, Alexey Morgunov, Vishal Nangalia, and Anna Rotkirch (2020) Universal Masking is Urgent in the COVID-19 Pandemic: SEIR and Agent Based Models, Empirical Validation, Policy Recommendations/Used with permission
Similarly, the researchers looked at daily growth curves to show that countries with universal masking culture or early and comprehensive adoption of masking had significantly flatter disease curves than countries that don’t wear masks to any large degree.
De Kai, Guy-Philippe Goldstein, Alexey Morgunov, Vishal Nangalia, and Anna Rotkirch (2020) Universal Masking is Urgent in the COVID-19 Pandemic: SEIR and Agent Based Models, Empirical Validation, Policy Recommendations/Used with permission
Finally, the researchers placed countries into a quadrant map showing percent reduction from peak on the x-axis and daily growth on the y-axis. Countries in the bottom right of the graph had the largest percent reduction from peak disease and the lowest daily growth–less spread, quick recovery. Countries in the top left quadrant have had the smallest reduction in disease from peak and the highest daily growth–more spread, slow recovery. The United States sits squarely in this quadrant but countries with universal mask wear sit alone in the best quadrant of the graph.
De Kai, Guy-Philippe Goldstein, Alexey Morgunov, Vishal Nangalia, and Anna Rotkirch (2020) Universal Masking is Urgent in the COVID-19 Pandemic: SEIR and Agent Based Models, Empirical Validation, Policy Recommendations/Used with permission
The evidence for universal mask-wear is now decidedly compelling. We should all be wearing masks and we should start yesterday. So convincing is the science that on May 14, over 100 health experts wrote a letter imploring governments to mandate the wearing of cloth masks to stop the spread of SARS-CoV-2. While some states have taken this to heart, only 15 have actually passed laws mandating the wearing of masks in public. Most of those states are on the Eastern Seaboard. The science here is quite clear; wearing masks will significantly reduce viral spread. If enough people embrace the practice and we don’t wait until it’s too late, we can even stop the virus in its tracks. I think the greatest argument in favor or mask-wearing for those who oppose it on political or personal freedom grounds are the potential benefits for business. If we work to effectively quarantine our noses and mouths, we may not have to quarantine our bodies when this virus begins to surge again. And it will surge again. It’s what viruses do.
My family and I will be wearing our masks to protect you and your family. I’d be really grateful if you returned the favor.
I’d like to thank De Kai from the Hong Kong University of Science and Technology and the International Computer Science Institute at UC Berkley who graciously allowed me to use the three figures and graphs from his excellent article cited above. Please see these additional links provided by the author for more information on his study and the importance of universal masking.
Mother and child during COVID-19 crisis/https://www.vperemen.com/Wikimedia Commons
Last week I was on call for public health and wasn’t able to post much. This long weekendwas about recovering from call. Hopefully I’ll get back into a more regular schedule this week.
The Basic Reproduction Number (R0/R-naught) for the US looks like it has crossed back above 1 for the whole country. The R0 is important if you remember because it describes how many people on average are infected by one person. As long as that number is below 1, COVID-19 cases will drop. Once it goes above one as it has now (estimated by Youyang Gu on his site) we’ll start to see overall increases in new cases of the virus nationwide.
Imperial College’s new study (not yet peer reviewed) reveals that 24 states have COVID-19 reproduction numbers that are above 1 (one) and therefore have growth of the virus. Their model which incorporates changing mobility of the population further reveals that only 15.7% of US states have truly credible reproduction numbers below 1 (one).
An article in Pediatrics examined the role children play in spreading COVID-19. Swiss researchers looked at family clusters of infected individuals and found that child to adult spread occurred in only 8% of cases. It was far more common for adults to spread the virus to their children. If this is true and validated by other studies it could have significant implications for the reopening of schools. It’s important to remember that children may still be important vectors for the disease since they have have a higher likelihood of having few or no symptoms even if they don’t spread the virus as commonly as adults do.
There were 675 new cases of COVID-19 in Riverside County over the Memorial Day weekend from Friday to Tuesday. This is a significant bump with an average of 168 cases per day over the four days. A few weeks ago, the county had been averaging under 100 cases per day. This increase is worrisome and very likely due to several factors including spread during Mother’s Day gatherings 2 weeks ago. Citizens of Riverside County have been much more mobile in recent weeks and now have a failing grade with Unacast Social Distancing Scorecard. It’s also likely that social distancing is less rigorous in general as quarantine fatigue has fully set in. Additionally, face coverings are no longer mandatory in Riverside county, an order rescinded by the Board of Supervisors–this factor alone may play the largest role in increasing numbers now and in future weeks. One might suggest that increased testing is responsible for the bump but testing is actually down in Riverside County so in all likelihood, we’re seeing higher numbers because the virus is spreading more. This is what viruses do when given the chance. As the county opens up under the Governor’s new criteria and people feel more comfortable congregating in churches, at the beach, in restaurants and in stores, look for the daily new cases to climb further.
In a study released this week in the New England Journal of Medicine (NEJM) researchers in Europe examined 7 lungs from patients who died of COVID-19, 7 lungs of patients with acute respiratory distress syndrome from influenza A (H1N1) and 10 age-matched non-infected control lungs. They examined the lungs using a variety of tools including immunohistochemical analysis, computed tomographic (CT) imaging, and electron microscopy, and measurements of genetic expression among other modalities.
Patients with COVID-19 and influenza can develop a condition known as acute respiratory distress syndrome (ARDS). ARDS is a very severe pulmonary condition that generally leads to worsening blood oxygenation (hypoxemia) that doesn’t respond well to oxygen and often results in patients requiring mechanical ventilation to survive. On x-ray, patients with ARDS can have a ground glass appearance and lung fields can show increasing consolidation to the point of near complete opacification of the x-ray. Histologically, the alveoli (air sacks in the lungs) are diffusely damaged and edematous (filled with protein containing fluid) often with hemorrhage (bleeding) and fibrin deposition (a marker for inflammation and coagulation).
The researchers set out to compare the lungs of patients with ARDS from influenza A to those with ARDS from COVID-19. There were some similarities. In general patients with ARDS from COVID-19 and influenza A had diffuse alveolar damage and edema but the edema in the influenza patients was more massive and correlated with the lungs of deceased patients with influenza weighing more than those who died of COVID-19. Both sets of patients had immune cells though there was some difference in the types of T-cells. With respect to measures of inflammation-related gene expression, COVID-19 patients had a total of 79 inflammation-related genes expressed but only 2 genes were uniquely differentially regulated in patients with influenza. The two groups shared an expression pattern for 7 genes.
Significant differences started to arise when the researchers looked at thrombosis and blood vessel pathology. The alveolar capillaries (very small blood vessels where gas exchange of oxygen and carbon dioxide occurs) were 9 times more likely to have microthrombi (small blood clots) and occluded small blood vessels in COVID-19. Additionally, the endothelium (cells that make up the walls of the blood vessels) and endothelial cell membranes of the COVID-19 patients showed significantly more damage from virus present within the cells than similar cells in influenza infected lungs. Finally and most surprisingly, from all of this vascular damage done by SARS-CoV-2 to the lungs of patients with COVID-19, there was significant angiogenesis (development of new blood vessels) in COVID-19 lungs. The combination of increased blood vessel cell damage and microclotting in patients with COVID-19 may be responsible for the lungs working overtime to create new blood vessels to compensate.
This study is small and because of that there could be other reasons for the differences seen between the two groups and the authors concede this. But these findings fit with the experiences of clinicians and researchers who report much higher frequency of clotting abnormalities and dramatic levels of inflammatory response in COVID-19 patients. It’s unknown if the angiogenesis has any effect on survivability either way–further studies may help to elucidate this question.
Governor Newsom relaxed California’s requirements for accelerated reopening. The new criteria focus less on how many deaths a county or municipality have and more on the number of cases. The new criteria will allow for up to 25 cases per 100,000 members of the population and no more than an 8% positive test rate. This was a major sticking point for larger counties as the previous criteria required a county have no deaths before they could reopen. It’s estimated that 53 out of 58 counties could be eligible to accelerate their reopening under these new requirements.
Drug maker Moderna announced yesterday that its COVID-19 vaccine passed an important test. This early phase included 8 people and results have demonstrated that the vaccine was safe for them and that it produced a strong anti-COVID-19 antibody response. The company then studied those antibodies in the lab and found that they had a neutralizing effect on SARS-CoV-2 in vitro (scientific term for in a testtube). This is a standard approach and generally bodes well for an antibody’s ability to neutralize the virus in vivo (scientific term for in a living organism). Moderna’s approach to vaccines is different. Traditionally a vaccine contains inactivated virus or virus proteins which when injected into the body fool the immune system into thinking a real virus is present. The body then starts making antibodies to the harmless version of the virus. Once antibodies are present, they can mount an effective immune response when exposed to the real thing. Moderna instead uses something called an RNA vaccine. Instead of injecting virus bits or inactivated virus, they inject actual mRNA (genetic material) which codes for specific proteins on or in the virus itself (e.g. spike protein important for viral entry into a human cell). If Moderna had injected DNA into the the body there might be a risk of that DNA disrupting the body’s normal genetic code, but mRNA doesn’t incorporate into our genes, it only gets read to make protein. Once the vaccine mRNA is in the body actually starts creating the protein from the pathogen and expressing it on cell surfaces which is then recognized by memory cells allowing an immune response to a virus that the body has never actually seen. When a real virus invades, the body is ready for it and attacks it before it can do real damage. This type of vaccine has some advantages over traditional vaccines. They can be produced more quickly and more cheaply, they are less dangerous for patients since there’s no virus being used for the immune response and they can be scaled up quickly for mass vaccinations during a pandemic. Moderna plans to move on to their next phase of testing which will be an expansion to around 600 patients. Very good news indeed, but remember it’s still a long way to knowing for sure that this vaccine works and is safe.
More and more data is showing that we could very effectively control the virus if we quarantined our mouth and nose more effectively. If 80% of the population was fully compliant with wearing masks whenever in public, the data shows we could stop the spread of this virus. This, of course, could have major implications for reopening our society and getting businesses back up and running. For an excellent dive into the importance of masks take a look at this must-read.
On March 23, former CDC Director Dr. Tom Frieden published an opinion piece on Fox News suggesting that Vitamin D could be protective against COVID-19. I’ve read the piece and it’s reasonable. Dr. Frieden gave a measured suggestion that maintaining normal Vitamin D levels could help stave off severe illness from COVID-19, particularly in vulnerable populations. He suggested taking a supplement but not overdosing and to check for drug interactions before doing anything. He was clear in stating that we don’t know if this will actually help prevent severe COVID-19 disease but we do know that Vitamin D deficiency is, irrespective of COVID-19, not a good thing.
Right now, we don’t know if Vitamin D deficiency plays any role in the severity of COVID-19. But given the high prevalence of Vitamin D deficiency in this country, it is safe to recommend that people get the proper daily dosage of Vitamin D.
Dr. Tom Frieden/Fox News
I don’t think it was Dr. Frieden’s intention, but from there things have gotten a bit more frenzied. There are a cacophony of voices now screaming the praises of a new cure-all for COVID-19 in the form of Vitamin D and perhaps more worrisomely, a segment of the community opposed to stay-at-home orders using Vitamin D’s possible association with COVID-19 severity as justification for defying this important public health intervention.
This is a bit of complex topic to discuss but I’m going to do my best to talk about the science of Vitamin D as it relates to disease and in particular respiratory diseases like COVID-19.
First, and briefly, let’s talk about what Vitamin D is. The term Vitamin D actually describes a group of chemicals important for normal human health. The Vitamin D chemicals are steroid molecules predominantly thought of as an important factor in calcium and phosphorus metabolism in the body and normal bone growth. Many cell types in the body, however, have Vitamin D receptors so its role throughout the body may be more complex and not yet fully understood. Humans get their Vitamin D from a few different sources; one important way to get Vitamin D is to eat it. Ergocalciferol (Vitamin D2) comes from some plants like mushrooms and is the primary form of Vitamin D in fortified foods like milk. Cholecalciferol or Vitamin D3 is found in meat, egg yolks, liver and fatty fish. Humans can also make Vitamin D through sun exposure. A common form of cholesterol (7-dehydrocholesterol) present in skin is converted to cholecalciferol or Vitamin D3–the UV light actually provides the energy for this conversion. So while we can get Vitamin D2 and Vitamin D3 in our diets and through UV light we can make Vitamin D3 in our skin, neither molecule is biologically active for humans. These forms of Vitamin D need to be further converted to active molecules in the liver and then in the kidneys. First, in the liver, cholecalciferol is converted to 25-hydroxycholecalciferol which has weak activity. This molecule is then converted in the kideys to 24,25-dihydroxycholecalciferol, which is also weakly active or 1,25-dihydroxycholecalciferol which is the active form of Vitamin D. This active form then goes on to significantly increase the absorption of calcium in the intestines.
Vitamin D pathway in humans
Low levels of Vitamin D in children are associated with Ricketts and in adults, low levels lead to osteomalacia (softening of the bones). For years this was pretty much the sum of knowledge about Vitamin D. Researchers now know that the same Vitamin D receptors in the intestine are present in many other organs throughout the body including the heart, the lungs, blood vessels, the prostate, muscles and endocrine glands to name some. These receptors throughout the body have led to research seeking to determine whether Vitamin D has additional roles in human health including with protecting against infections, boosting immunity or quelling inflammation.
Let’s get back to COVID-19 why people think our levels might be important with respect to preventing the illness or protecting against severe disease. For some time there has been evidence that low Vitamin D levels put people at risk for acute respiratory tract infections (ARTI) like ear infections, colds and even pneumonias. Furthermore, studies seem to show that the risk of severe disease and dying has an almost linear relationship with decreasing Vitamin D levels in the population being studied. With the emergence of COVID-19, also an ARTI, researchers started looking at Vitamin D as a possible factor in disease severity. COVID-19 studies show a similar correlation between Vitamin D deficiency and disease severity. In general, it seems the people most at risk for Vitamin D deficiency like those with chronic disease, seniors, and people of color also seem to be at the highest risk for severe COVID-19 disease. A very recent study looked at countries with high prevalence of Vitamin D deficiency and compared them to countries with low prevalence. They found that countries like Sweden, Norway and other Scandinavian countries with low prevalence of Vitamin D deficiency have lower infection rates and fewer deaths. Countries with more Vitamin D deficiency like Spain and Italy have the highest infection and death rates.
So while all of this is compelling on the surface, let’s take a deeper look. The studies on COVID-19 and Vitamin D have all been observational studies. In an observational study, researches simply observe what happened (retrospective) or what happens down the line (prospective) to a group of people and infer from the data they collect. In an observational study, no experiment was applied and tested. It’s just as the name suggests, an observation. This doesn’t make observational studies bad; it’s just important to understand their limitations. The data from observational studies, which are much easier to complete than experimental studies, can be quite compelling and in medicine they often drive interest in the direction of experimental studies. But scientists are hesitant to draw significant conclusions from them because the information shows correlation, not causation. Take for instance this scenario: an eager medical student at a large teaching hospital wants understand the factors that increase likelihood of death during code blue (emergency situation in a hospital involving cardiac or respiratory arrest). Over the course of his ICU rotation he observes the code blue emergencies and records the medications given, amount of oxygen delivered, type of chest compression administered…he observes and records everything he can think of. One day as he’s looking at his data he sees something quite remarkable. One factor stands out for him: the more doctors there are in the room during a code blue, the more likely a patient is to die.
Observational studies provide us with important information but they show correlations, not causations. In fact, you’ve probably heard the saying, “correlation does not equal causation”. As in our example, the number of doctors in the room during a code blue is probably related to (correlates with) the complexity of the patients condition and code event; the sicker the patient or the more difficult the resuscitation, the more doctors are needed. It’s unlikely, we hope, that a higher number of doctors in the room during the code is actually causing the patient to die. So back to our Vitamin D studies. The information obtained in these studies is good but it is observational and by the authors’ own admission, they show correlation not causation. Are the patient’s sicker because they have low Vitamin D levels or are the patients most likely to be sicker (seniors, those with chronic conditions, people of color etc.) people who are also more likely to have low Vitamin D levels. To answer these questions, experimental studies or clinical trials need to be undertaken. In experimental studies we look for the classic double blinded, placebo controlled randomized trial. In other words we want a study in which people are randomized into two groups, one group gets Vitamin D and the other group gets placebo and neither the doctors nor the patients involved in the study know what they’re getting. At the end of the study you look at the data to see which group did better. That gets us on the road to knowing whether Vitamin D is protective against severe COVID-19 disease.
To my knowledge there are no clinical trials on Vitamin D in COVID-19 that have yet reported their results but there are some trials currently underway to assess whether Vitamin D may be helpful in the treatment and/or prevention of severe COVID-19 disease. There’s a study looking at whether a single dose of 25,000 IU of Vitamin D will improve mortality in patients with mild disease. There’s also a study looking at several different doses for patients with more severe disease who are older than 75. Time will tell if Vitamin D plays an important role in COVID-19 but at this point we don’t know, we simply have the correlation.
All that said, we do know that it is not good to have low Vitamin D levels in general. For any person, the goal for all our nutritional indices is to be in the normal range–it’s how we work best. So given that, for patients with COVID-19 it’s reasonable for treating physicians to provide Vitamin D supplementation if levels are low–as would be true with any patient irrespective of COVID-19 status. Whether this helps fight COVID-19 specifically we don’t know yet. We also do not at this point have evidence that people with normal Vitamin D levels should further supplement with Vitamin D in order to protect against COVID-19 disease.
My greater concern with respect to possible links between Vitamin D and COVID-19 is that this questionable connection seems to be being used as an excuse to disregard public health measures that control the spread of SARS-CoV-2. Those who perhaps are already questioning the usefulness of social distancing or stay-at-home orders are suffering from confirmation bias by using the possible link to suggest that these public health interventions are counterproductive or dangerous and should be ignored because they’re keeping people indoors and reducing their sun exposure. At the very least, some are using this data to justify actions known to be dangerous like converging at the beach on a beautiful day. Social media is filling up with claims that if you want to fight the virus, forget this stay-at-home stuff, get out there and get some sun. Go to the beach! Play some sports! The clear implication is that getting Vitamin D is more important than not getting the virus. There is simply no evidence that this is true. If you get the virus you could die or someone you love could die and there’s no evidence your Vitamin D level or sun exposure will save you or your loved one. Short of a vaccine, public health measures like social distancing and stay-at-home are the single most important thing we can do to prevent the spread of this disease to vulnerable populations and subsequently causing preventable deaths. In some ways, outdoor activity and sun exposure is being presented as a false dilemma. Most public health experts (with some exceptions in very densely populated cities) have not restricted people to their homes and have encouraged outdoor activities that adhere to social distancing (no congregating in groups, keep appropriate space especially if exercising) and viral spread control measures (e.g. face masks). If you live in an area where these activities are permitted then by all means please undertake them. Being healthy is always a good thing when it comes to giving human beings a leg up at surviving illness but don’t use this fact to ignore public health measures designed to prevent you from getting COVID-19 in the first place. You really don’t want to get this infection, or at the very least, you don’t want to give it to someone you care about who may not be able to survive it.
The National Ensemble Forecast analyzes data from 12 different models to created an ensemble forecast/CDC
Predictive models for US deaths are beginning to coalesce around a projection of 110,000-115,000 deaths by June 6. By August 1st we’re looking at around 180,000 deaths.
Youyang Gu has used the data from his incredibly accurate COVID-19 model to calculate Infection Fatality Rate (IFR) of about 1% for the virus. The IFR is difficult to know during a pandemic and may not be fully fleshed out for years. The IFR is the percentage of people who die out of the total number of people who are infected (whether or not they are test-confirmed or symptomatic). Because we won’t know this data for some time the IFR is elusive during a pandemic. What Gu has done is use the accuracy of his model as a starting point and reference and then calculated curves based on IFRs from 0.2-1.5%. The IFRs that had the smallest variance from his curve came in around 1% (0.9-1.2). This is similar to other estimations of IFR from New York data which come in at around 0.91%. It would appear from these estimates (and make no mistake, they are estimates) that COVID-19 is approximately 10 times more deadly than flu–basically the estimate Dr. Fauci gave to Congress during his testimony. The Case Fatality Rate (CFR) is much higher than the IFR because it is a measure of deaths out of the total number of confirmed cases (e.g. only those cases that have tested positive for the disease and not the untested or the asymptomatic) and the mortality rate is lower because it is a measure of deaths as a part of the total population (i.e how many people died from a disease out of the entire population of the US). The term “mortality” is often used familiarly to describe the IFR and sometimes the CFR but it is important to know that they are all actually different measures of death due to disease. It should be noted that to focus solely on deaths in a pandemic is a myopic approach and doing so does not reveal a fully accurate picture of disease severity.
Cases in Orange County are increasing week to week (441-664-787) following the crowds converging on the beaches on April 25th and 26th. It’s concerning but at this point it’s nothing more than correlation; it’s not known if the crowding caused these increases. If a link exists, contact tracing may reveal it. The increase in cases could be related to an increase in testing as well as OC has been lagging behind other counties in the region. The increases in recent weeks could also merely be a statistical aberration and numbers could soon fall. It will be important to follow OC’s numbers either way as it has been a gathering point for people seeking the sun and, in some communities, for people protesting stay-at-home orders.
CDC graphic shows spread through 87% of choir practice participants from one symptomatic individual/cdc.gov MMWR
The Morbidity and Mortality Weekly Report (MMWR) by Lea Hamner et al. released today describes the impressive spread of SARS-CoV-2 from one symptomatic individual to 53 (33 confirmed and 20 probable) out of 61 members of a choir in Washington State. Of those infected, two eventually died.
The report startlingly illustrates some important phenomena related to rapid viral spread. First it’s important to understand that there are likely individuals who inherently spread more virus than the average person or there are at least circumstances that facilitate greater spread. A study by Asadi S. et al. in 2019 showed that the louder the voice, the greater the aerosol emissions. This is likely also true whenever forceful exhalation occurs. With activities like singing or vigorous exercise there comes the possibility that some individuals may be considered super-emitters who spread a much greater amount of virus-containing aerosols than typical individuals in normal situations. In this case the symptomatic choir member’s singing may have made them a super-emitter. On top of that, prolonged exposure in an enclosed space with little to no social distancing was an additional setup for aggressive viral spread through a large group; this is know as a superspreading event (SSE). SSEs are important public health concerns and have been documented in many pandemics. In a COVID-19 SSE, an infected individual can spread the virus to far more than the usual 2-3 people a typical person with SARS-CoV-2 does. In the Washington SSE for instance, the symptomatic choir member likely passed the virus on to dozens of people. SSEs are more likely to occur during gatherings at churches, concerts, sporting events, birthdays, funerals and at gyms or fitness centers. In each case we see the potential for a dangerous combination of people with loud voices or heavy breathing (super-emitters) coming together with large groups of people in enclosed spaces with less than optimal social distancing to create SSEs.
This report highlights the logistical challenges with large-scale reopening of society and businesses in the era of COVID-19, particularly for the highest risk sites. When venues such as those listed above do open, great care must be taken by both organizers of the venue and by visitors to the venue to reduce the risk of SSEs. Even with substantial attention and effort, it remains to be seen whether high-risk venues will be able to convince skittish visitors or members that it is safe to return as long as the virus is present in the community or until an effective vaccine is available.
Very briefly tonight because it’s late. The docs at MGH FLARE presented a study out of Hong Kong showing significant improvements in recovery time for patients with COVID-19.
The study, a randomized trial, looked at combination treatment with Interferon beta-1b and two anti-viral medications, lopinavir-ritonavir and ribavirin. Interferon beta-1b is part of the innate immune response and it’s utility as an anti-viral has been studied before including during MERS-CoV when it helped speed recovery. Ribavirin is a medication that inhibits viral replication and has been used to treat viral infections for years. Lopinavir-ritonavir is a protease inhibitor created to fight HIV.
The three medications when used together and given early in the course of the infection improved time from start of treatment to negative nasopharyngeal swab (7 days in study group, 12 days in control). Similarly, statistically significant improvements in time to resolution of symptoms as measured by NEWS2 score (4 days in study group, 8 days in control), shorter time to SOFA (Sequential Organ Failure Assessment) score of 0 (3 days in study group, 8 days in control) and shorter mean hospital stays (9 days in study group, 14 days in control). No deaths occurred in the control or study group so differences in mortality couldn’t be assessed.
I find these results very exciting. It’s still early and larger randomized trials will tell us more but the hypothesis shared by many that combination therapies might be the best approach to finding a successful treatment regimen for COVID-19 seems to be bearing fruit in this study.
One of the really cool things about staying off of Facebook is that I’m not bombarded with conspiracy theories all day. One of the bad things about leaving Facebook is that I’m not bombarded with conspiracy theories all day. I, for instance, just found out that there’s a video called Plandemic spreading around the internet like a…well…pandemic (apologies), which is so rife with conspiratorial falsehoods it’s basically the holy grail of science blogging. I’m so late to the game on this that the video isn’t even around anymore to view. I was able to dig deeper into the bowels of the internet and find it but I’m so late to the game I’m not going to tackle it. Others have done an expert job of that already. If you’ve seen the video and found some of the points made therein to be compelling, you probably owe it to yourself to read If You Found that ‘Pandemic’ Video Convincing, Read This Too, by Beth Skwarecki of LifeHacker. I don’t think anybody could do a better job of point-by-point addressing the Plandemic video, certainly not me.
Instead what I’d rather do is provide a bit of a handy guide, a questionnaire of sorts, to help you know when you are at the greatest risk of believing a conspiracy theory. Let’s all answer a few questions about ourselves.
The Questionnaire
How helpless do you feel right now?
Do you feel completely powerless as life-altering decisions are made by people in suits miles and miles away from your reality?
How vulnerable do you feel right now?
Do you feel that there are imminent threats to your health, finances or freedoms?
How confused are you right now?
Do you feel overwhelmed by conflicting information and are finding it hard to know what to believe since information yesterday is different from today and one contradicts the other?
How threatened does your way of life feel right now?
Do you feel that there are people with ideologies counter to yours who are intent on changing the status quo to make your life worse or damage America irreparably?
How involved in political wrangling are you right now?
Do you engage in frequent arguments about politics with people who simply ‘don’t get it’ or do you frequently post memes and comments that denigrate people on the opposite side of the political spectrum?
How much social media are you consuming right now?
Do you find yourself increasingly drawn to social media platforms looking for some information that makes sense or for people who are similarly confused and frustrated with how things are going?
Discussion
If you answered, ‘a lot’ to some of these questions you’re probably at risk to believe in a conspiracy theory. The thing is, because of our current health and economic crisis almost every human on earth can answer ‘a lot’ to one or more of those questions and is probably at risk of believing conspiracy theories. That, frankly, is why there are so many flooding the internet these days.
Feelings of helplessness are commonly associated with a predilection for believing conspiracy theories. During the COVID-19 crisis many Americans feel like decisions that affect lives are being made by politicians and policy-people from hundreds of miles away. Elected and public health officials call all the shots and the average Joe has no say in the matter. The more helpless and out of control people feel, the more likely they are to try to find some measure of control. Often people try to find alternate explanations than those given by the people responsible for taking away control in the first place. Conspiracy theories provide that along with a comforting feeling that the believer is part of a select few who know the real truth.
Similarly, the anxiety that comes from vulnerability drives people to believe conspiracy theories. Millions of Americans have lost their jobs and face an uncertain future. Millions of small businesses are at risk of closing permanently because of the COVID-19 stay-at-home orders. For many, the stress of COVID-19 itself can be oppressive. Conspiracy theories can provide an explanation for the seemingly inexplicable change in peoples lives; life was completely normal four months ago and now it’s completely abnormal. Somebody or something had to be responsible for this dramatic turn of events.
The breakneck speed of COVID-19 and the response has led to unavoidable conflicting information from scientists, politicians and public health experts. Part of the fundamental nature of science is that it changes and is slowly fine-tuned or honed by additional data. This can produce an uncomfortable amount of confusion in the best of times, during the COVID-19 pandemic this has been difficult to process and keep up with for even the world’s foremost experts in virology and public health. For many, this confusion reaches a tipping point that leads them to conclude that events transpiring are simply too fantastical to believe. From there they seek alternative explanations and find many, much easier to chew than the science of pandemics, in conspiracy theories.
According to recent research, people who feel that fundamental societal values are under siege or directly threatened by those who believe differently are at an increased risk for believing in conspiracy theories. These individuals are likely to believe that there is an influential group of people who do not share the same values and are intent on disrupting the status quo. For people who feel this way, there is a common thread that nothing happens by accident; there is always someone or something at play to explain current problems or crises.
Studies show, the more politically entrenched a person is or the more they feel their way of life is threatened, the more likely they are to believe in conspiracy theories regardless of which end of the political spectrum they live. Generally, the politically preoccupied believe conspiracy theories that malign the other party and the people who belong to it. To make matters worse, the more someone overestimates what they know about politics or policy, the more likely they are to believe in clandestine, powerful agents acting against the common good. Having entrenched views and overestimating personal knowledge are particularly strong risk factors for belief in conspiracy theories.
The internet, in particular social media, provide people a perfect medium to spread unfounded ideas. The relative absence of gate-keepers gives free rein to conspiracy theorists to post their claims and allows them to find thousands of like-minded believers. This can give the group in question the gratifying feeling that they alone have the truth and that they share a secret that the rest of the world is ignorant of. In general, conspiracy theorists are far more active and share far more posts on social media than the people who debunk them. In part this comes from the belief that they have a secret truth that must be shared. Social media intensifies conspiratorial thinking.
The COVID-19 pandemic has created a perfect storm of risk factors for believing conspiracy theories. We’ve reached a point where almost every American has at least several of these risk factors and we’re seeing that play out on social media with an infectious spread of machinations designed to dupe vulnerable people into believing untruths. Honestly, I think it’s understandable; we all have doubts and we all want the truth so we go looking. It’s good to have an inquisitive and questioning mind. It’s vital though, to know when the answer to our inquisitiveness is devoid of real evidence. Most of us laugh when we hear someone bloviate about the “clear evidence” of a flat Earth or the undeniable “truth” that the moon landing was faked. For many of us, these ideas are so absurd that we ignore them and refuse to engage. It’s important to remember, however, that a belief in conspiracy theories, no matter how bizarre, is underpinned by a fundamental mistrust of science and expertise and the more pervasive these ideas, the more dangerous it is for society. We see this now with the conspiracy theories surrounding COVID-19; they are a direct threat to our personal health and the health of our economy (see On Bitter Pills). When society relies on every member to step up to protect the common good, it only takes a few to endanger the lives of millions. Since we all have some risk these days, it’s vital we steel our minds and take a moment, maybe several, before we post that potentially conspiratorial or highly political meme. Better still, take a break from social media or at least let’s clean up our social media feeds to remove the incendiary pages, and for the love of all that is good and holy, don’t ever look at the comments. No good can come from that.
COVID-19 death counts and accusations that they have been inflated is a topic I’ve avoided writing about because it’s politically charged. When something becomes political these days it moves away from the realm of science and into the realm of dogma, or quasi-religion. That’s why I shun politics. How do you rationally and logically discuss something that contradicts an almost religiously-held political belief? It’s like trying to convince someone that your religion is far superior to theirs and that all their theological ideas and canon are wrong. No good can come from it. This is the state of politics in America. In spite of this and against my better judgement I’m going to tackle the highly politicized issue of death counts because it’s that important.
Much of this started when Dr. Scott Jensen, who also happens to be a Republican State Senator in Minnesota, claimed on Fox News that doctors were being encouraged by CDC death certificate guidelines to list COVID-19 as a diagnosis even when there’s no clear evidence of COVID-19 infection. He went on to suggest that there was a financial motivation to list COVID-19 as a diagnosis because Medicare pays $13,000 for a COVID-19 and $39,000 if that same patient is placed on a ventilator. He also stated that doctors have a different approach when caring for patients with influenza. He used a hypothetical case of a patient with influenza who died during the course of the illness with a pneumonia as well. For him that death would be due to respiratory failure and pneumonia.
Jensen gave a hypothetical example of a patient who died while suffering from influenza. If the patient was elderly and had symptoms like fever and cough a few days before passing away, the doctor explained, he would have listed “respiratory arrest” as the primary cause of death.
“I’ve never been encouraged to [notate ‘influenza’],” he said. “I would probably write ‘respiratory arrest’ to be the top line, and the underlying cause of this disease would be pneumonia … I might well put emphysema or congestive heart failure, but I would never put influenza down as the underlying cause of death and yet that’s what we are being asked to do here.”
Dr. Scott Jensen/Fox News
Dr. Jensen and others have also called into question a CARES Act provision that pays hospitals a 20% bump over Medicare payments for patients with COVID-19. With financial incentives like this the clear implication is that doctors and hospitals are cooking the books, in effect, to unethically profit off of the crisis. There also seems to be a growing sentiment that above and beyond financial interests, that COVID-19 deaths are inflated in order to damage the President and increase the likelihood that he will lose the general election in November.
There’s a lot to unpack here but I’ll do my best. As always, I’m going to do my best to steer clear of politics and just try to address the accusations. For me, the most important reason to answer the allegations because of the damage they unfairly do to the public’s trust of doctors, hospitals and public health system. I’ll briefly discuss Dr. Jensen’s claims and why they don’t make sense to me. Ultimately you may choose to believe him over me but know that I don’t have a financial interest in COVID-19. On the contrary, as long as this crisis disrupts the economy my family is taking a financial hit like so many other American households. Life will unquestionably be better for me when this is over; I have no desire to make it seem worse than it is or drag it out longer than needed. I do have a great desire to help people understand how truly dangerous this virus is which is a different thing altogether. After I address Dr. Jensen, I will provide some data that I think shows pretty clearly that numbers aren’t exaggerated, in all likelihood COVID-19 deaths are undercounted.
Let’s take a look at the claim that hospitals get $13,000 for a COVID-19 admission and $39,000 for ventilation of a patient with the same diagnosis. These numbers are pretty close to the truth but what Dr. Jensen didn’t mention is that they are taken from the same diagnosis-related group (DRG) that covers other similar respiratory conditions. The Kaiser Family Foundation found that “average Medicare payment for respiratory infections and inflammations with major comorbidities or complications in 2017, which was $13,297.” They also found that “the average Medicare payment for a respiratory system diagnosis with ventilator support for greater than 96 hours…was $40,218.” So the base payment for hospitalization and/or ventilation for COVID-19 is actually pretty much identical to the payment for similar respiratory conditions. Well, what about the 20% bump you might ask? It is definitely true that this bump exists; it is part of the CARES Act that Congress passed and the President signed to help get the country through the crisis. The 20% bump is designed to help hospitals cover the added costs of caring for COVID-19 patients including personal protective equipment, isolation and disinfecting costs, and in particular the cost of caring for the uninsured. By paying a bit more for every Medicare patient, hospitals are better able to handle the added costs of caring for patients who have no insurance and likely will never be able to fully pay for their care assuming they survive to try.
As far as Dr. Jensen’s accusation of pressure to list COVID-19 on death certificates I’d also argue that the CDC’s guidance on certifying COVID-19 deaths is not unreasonable. This is based on my experience as a physician and public health doctor during the crisis. I definitely don’t think that this is resulting in a statistically significant over-counting of COVID-19 but more on that later in the post. Here’s the CDC’s exact wording.
In cases where a definite diagnosis of COVID-19 cannot be made, but it is suspected or likely (e.g., the circumstances are compelling within a reasonable degree of certainty), it is acceptable to report COVID–19 on a death certificate as “probable” or “presumed.” in these instances, certifiers should use their best clinical judgement in determining if a COVID–19 infection was likely. However, please note that testing for COVID–19 should be conducted whenever possible.
Guidance for Certifying Deaths Due to Coronavirus Disease 2019 (COVID–19)
You don’t have to believe me on this but this practice is not unusual for certification of death. There has never been a cookbook method of listing causes of death. For patients with infectious diseases, high suspicion based on clinical presentation and exposure history can inform decisions about cause of death even in the absence of laboratory tests. I fully disagree with Dr. Jensen on one of his points. He suggested in his Fox News interview that he never codes a patient who has tested positive for influenza as an influenza death if the patient has pneumonia. He reports he would list that death as respiratory failure and pneumonia. I do not believe that is the practice of the majority of US physicians nor do I believe it is appropriate. For patients such as this, the acute illness with influenza, should at least be included as a secondary diagnosis as it certainly contributed to the patient’s death.
So enough about Dr. Jensen. Let’s take a look at the data that to me shows that deaths are indeed real and not over-counted. The data shows they are actually significantly undercounted. The New York Times has been tracking year to year differences in deaths in seven states with some interesting results. When compared to the previous five years New York City for instance had 225% more deaths (11,900) this year between March 8 and April 11 than the same period for the last five years–no year came anywhere close. The rest of New York had 42% (4200) more deaths than previous years and New Jersey had 72% (5200) more. Other states showed the same trend: Michigan had 21% (2000), Illinois came in at 13% (1400) and Massachusetts was higher by 20% (1200). Where did these deaths come from if not COVID-19? Did we suddenly have large aberrant spike in trauma deaths or cardiac deaths or cancer deaths in multiple states this spring? I think it would test the bounds of credulity to suggest this is the case. The truth is, I think, simpler; this spring we were hit with a dangerous virus that can hide in seemingly healthy people and spread easily to close contacts causing a disturbingly common severe respiratory distress syndrome with or without multisystem organ failure.
Excess U.S. deaths Hit Estimated 37,100 in Pandemic’s Early Days, Far More than Previously Known/Washington Post
If that’s not enough, consider this. In all of the states I mentioned and that the Times followed, the number of confirmed COVID-19 deaths is lower than the total number of extra deaths. In other words, COVID-19 deaths were undercounted in NYC (1700), NJ (3000), NY State (1700), Michigan (600), Illinois (700) and Massachusetts (500) over that time period. The Washington Post looked at the early days of the pandemic and measured excess deaths across the country and found similar data–we had far more deaths than normal years and there’s solid evidence that we didn’t catch all of the COVID-19 cases.
I can understand that some Americans may have doubts about COVID-19 numbers, particularly when physicians step forward to suggest that something fishy is going on. It’s reasonable to feel this way and it’s important to hear out critics of any system. I don’t believe Dr. Jensen is lying and I don’t believe he is a bad person. He’s undoubtedly an excellent, dedicated doctor to the patients in his practice. I think just think he’s wrong about this and in my mind the data confirms this.
Vaccines For Children (VFC) study showing week to week differences in vaccines ordered from the VFC for non-influenza routine vaccines and measles containing vaccines and week to week comparison of administered measles-containing vaccine.
Santoli JM, Lindley MC, DeSilva MB, et al. Effects of the COVID-19 Pandemic on Routine Pediatric Vaccine Ordering and Administration — United States, 2020. MMWR Morb Mortal Wkly Rep. ePub: 8 May 2020. DOI: http://dx.doi.org/10.15585/mmwr.mm6919e2external icon
A study by Santoli et al. is showing that there has been a sharp drop in ordering of routine non-influenza and measles-containing vaccines since the national state of emergency was declared over COVID-19. There was also a very worrisome drop in the administration of measles-containing vaccine. Parental concerns about COVID-19 have produced a sharp drop-off in routine well check exams leaving many pediatric offices nearly empty. The drop-off in measles vaccination has been much greater for kids over two years of age but both age groups have been significantly impacted. The trend is slowly reversing but the risk of a pediatric disease outbreak is growing every day as vaccines become more and more delayed. Measles vaccination rates need to be maintained at around 95 percent to prevent outbreaks so whenever a significant portion of the pediatric population is delayed with their shots, measles could take hold and spread. Rates in the US are already worrisomely low coming in at 91.5% with some states below 90%. A measles outbreak on top of our current COVID-19 pandemic could be devastating to kids and cause further strain on a critically ill economy.
Measles/CDC
Pediatric offices have made major changes to assuage parental fears of contracting SARS-CoV-2. Most practices offer telehealth visits for the physician portion of the well-child visit. When in-person visits are required, many offices now have blocked-off the morning for well patients with comprehensive cleaning between visits and before the sick visits in the afternoon. Many offices have closed waiting rooms and instead call families in from their cars when it’s time for their appointment. While protecting against COVID-19 is important for families, it’s vital that we quickly bump up our vaccination rates and provide catch-up vaccination for those behind or we risk preventable outbreaks on top of a pandemic. Contact your child’s pediatrician or pediatric care provider to see how you can get your child’s well check and vaccines taken care of so that they’re fully protected.
The Washington Post is reporting that cell phone data tracked by the University of Maryland’s Transportation Institute showed that tens of thousands of people flocked to Georgia after businesses were permitted to open. Over 60,000 more trips into the state were recorded than the week before the opening on April 24. Most of these travelers came from Alabama, South Carolina, Tennessee and Florida. I’ll be keeping an eye on new case data for these five states over the next 2-4 weeks to see if numbers there start to move and will post updates.
This week my home province of New Brunswick, Canada had its first new cases of COVID-19 in two weeks. At least one of the cases is travel related. The positive individuals are in the Saint John and Fredericton areas and come just as the province has begun a phased reopening. By all estimation the province’s public health department has done a superb job managing the pandemic within its borders. The new cases serve as a reminder that the virus isn’t gone and that even in communities who have done almost everything right, it will invariably find its way back in via the path of least resistance.
Though known for a while, there are increasing reports that patients with COVID-19 are suffering from abnormal blood clotting. A study published in the Annals of Internal Medicine found that 58% of 12 post-mortem examinations found deep vein thromboses in patients with COVID-19. There is a growing use of blood thinners to treat the sickest patients in centers around the country. It’s difficult to know at this point whether these clots are part of a well known medical phenomenon related to severe inflammatory states and shock called disseminated intravascular coagulation (DIC). In DIC, extremely ill patients both bleed too much and clot too much at the same time–it’s a clotting system gone haywire and a very difficult problem to manage in critically ill patients. Some of my worst nights during training were spent at a kid’s bedside trying to get them to stop bleeding and clotting, a tragically difficult task. It could also be that there’s something about COVID-19 that specifically causes abnormal clots to develop. Large scale studies are needed to determine the cause and to sort out appropriate treatment but blood thinners seem to be working their way into current standards of care.
Coronary Artery Aneurism in Kawasaki Disease/Wikimedia
Doctors in New York have issued an advisory warning of a possible inflammatory complication of COVID-19 in children. Sixty-four kids in New York have developed a condition described as an inflammatory syndrome affecting multiple systems including the heart and blood vessels. The syndrome appears to be similar to another more well-known pediatric condition called Kawasaki Disease. Children with Kawasaki Disease have prolonged fever, rash, enlarged lymph nodes, red lips and tongue, joint pains, swollen hands and feet, and conjunctivitis without discharge or pus. Kids with Kawasaki Disease are at risk for inflammatory changes to the coronary arteries that can cause the heart vessels to develop life-threatening aneurisms. While the new COVID-19 related syndrome affects the heart it’s unclear if it causes the same aneurisms as Kawasaki Disease or instead causes general inflammation of the organ. Some children with the COVID-19 related inflammatory syndrome have develop cardiovascular collapse similar in appearance to Toxic Shock Syndrome, a finding not typically seen in Kawasaki Disease.
The usual caveats apply here. Everything we know about SARS-CoV-2, the virus that causes COVID-19 is new. We’ve only known about it for about 4 months or 5 months. Our understanding is changing daily as researchers around the world mobilize to develop better treatments and vaccines. Research released in this kind of time-frame has, by definition not undergone rigorous scientific review so it too may change as additional data comes in. All that said, a paper by Ni et al. is being submitted for publication that looks at whether SARS-CoV-2 generates lasting immunity by way of antibodies and does that immunity act to neutralize SARS-CoV-2.
First some basics about the human immune response. If this is old hat to you then skip ahead a couple paragraphs. When a pathogen like COVID-19 enters our body, specialized white blood cells like neutrophils and macrophages hunt these pathogens down and directly kill them. The goal of this more primitive evolutionary immune strategy is to try to quickly neutralize pathogens while while buying time for more sophisticated immunity to develop. This innate immune response, in addition to just killing, triggers what is called adaptive immunity, a more recent evolutionary development.
Adaptive immunity involves B-cells (humoral response) and T-cells (cellular response). These cells are attracted to the battle between the specialized white blood cells and the pathogen by signals from the innate immune system cells. B-cells, after coming in contact with a pathogen make antibodies specific to it. These circulating antibodies can then coat the pathogen, making it harder for it to attach to our cells and easier to be identified for killing by other immune cells. Two types of T-cells are important in the immune response to infection. Cytotoxic T-cells become potent killers of cells that have been infected with the pathogen. This is important because an infected cell becomes a factory for making new virus so the body must destroy it to stop the spread. T-helper cells create chemical messages (cytokines) that stimulate the B-cells to make more antibodies to the pathogen, help Cytotoxic T-cells to destroy more infected cells and macrophages to attack the pathogen directly.
Ni et al. looked at 14 patients recovering from COVID-19, 8 on discharge and 6 two weeks after discharge. They found that antibodies to specific antigens (e.g. spike protein on the surface of SARS-CoV-2) were present in both groups of patients after infection. They then looked to see if these antibodies could neutralize SARS-CoV-2. The investigators utilized a pseudovirus particle-based neutralization assay to study the antibody response. This test uses a hybrid virus with components of the pathogen making up the surface but a more harmless retrovirus at its core. This is a useful approach when the virus being studied is particularly dangerous like with SARS-CoV-2 and Ebola and could infect the researchers. With the assay, they showed neutralizing activity from antibodies to the S-RBD (spike protein antigen), indicating that antibodies produced during the immune response can work to neutralize SARS-CoV-2. Finally, they looked at the cellular immune response (T-cell response) to the virus. They isolated monocytes from patients who had been infected and treated them with two important SARS-CoV-2 surface antigens and found that there was an increase in IFN-γ-secreting T cells in recovered patients. This indicates that antigen specific T-cells are produced after infection with SARS-CoV-2. Altogether it appears from this study that both the humoral and cellular immune response have been activated and are working together to create immunity.
So what does all this mean? From this data we can see evidence that the two arms of our immune system are both activated in response to SARS-CoV-2 and that they work together to create immunity that looks like it has all the hallmarks of being sustained. In other words, once infected, it appears that the infected individual should retain some level of immunity to the virus for a prolonged period of time. Here’s hoping!
When it comes to COVID-19, the role blood pressure medications like angiotensin-converting enzyme (ACE) inhibitors (e.g. Lotensin, Vasotec, and Zestril) and angiotensin-receptor blockers or ARBs (e.g. Losartan/Cozaar and Irbesartan/Avapro) has spanned a full spectrum of possibly having a beneficial effect to potentially worsening outcomes. The reason these medications have come under scrutiny lies with the way SARS-CoV-2 attaches to and then invades human cells. The virus attaches to a receptor called ACE2, present on lung, heart, kidney, gut and nasal cells, and with that attachment begins the process of invading the cell. This same ACE2 receptor plays a role in the mechanism of action for both medications.
Early reports from China indicated that a significant number of the very sick also suffered from hypertension. As SARS-CoV-2’s mechanism of viral attachment to cells became more clear, it led Lei Fang from the University of Basel in Switzerland along with other colleagues to postulate a possible up-regulation of ACE2 receptors for people taking this class of anti-hypertensives might facilitate viral attachment and lead to higher infection rates and/or more severe disease. From that, the question of whether to discontinue these medications for people who are infected with SARS-CoV-2 to help prevent severe disease or even discontinue these medications in healthy individuals has been posited.
On May 1 the NEJM published the results of three observational studies of 8,910 (11 centers around the world), 6,272 (Lombardy, Italy) and 5,894 (New York) patients found no link between ACE inhibitors or ARBs in risk of death, likelihood of infection or seriousness of infection. These observational studies should be followed up by larger randomized studies but they provide a solid starting point for answering the question of whether these medications should be discontinued–they shouldn’t. This early data suggests you should keep taking your ACE Inhibitors and ARBs and that doctors should continue them in the hospital should you become sick.
To highlight how much we don’t know about SARS-CoV-2, it is also postulated that these medications, particularly the ARBs, may have a protective role against severe disease. The ARBs, as the name suggests, block the ACE2 receptor and may prevent viral adherence to it. Studies are underway to answer this question but data is not available at this time.
Governor Newsom announced the start of Phase II of California’s COVID-19 response today by allowing limited pick-up service openings for businesses like book stores, sporting goods stores, and florists as early as this coming Friday. This is a measured loosening of restrictions to be sure as there’s no real congregating allowed and this is probably the most that could safely be undertaken at this point. We have not met several of the criteria outlined by infectious disease experts for safe relaxation of stay-at-home orders. In particular, while testing is increasing, we are not at the level where comprehensive evaluation of any symptomatic person can be achieved with results on the same day or within hours. Additionally, it’s not clear that daily new cases are declining let alone for 14 days straight, another of the primary relaxation criteria. Given this, it’s a bit of a risk to begin loosening of restrictions at this point but I’m guessing he hopes allowing these relatively safe activities will help put an end to the incredibly risky behavior of protesters around the state in recent days. Some experts like Dr. Robert Kim-Farley from UCLA are predicting that Phase III which will include the opening of higher risk businesses like movie theaters and gyms might occur sometime in the late summer, possibly August or September. Timelines like this are notoriously difficult to predict however, since they sometimes depend on non-medical decision making by political leaders. I wouldn’t be shocked to see that timeline bumped up somewhat.
It seems pretty clear now that the United States’ COVID-19 disease course is not following a Gaussian curve with an equal slope on the way up to and down from the peak. Instead the disease is declining at a much slower rate than when it ramped up to the peak. This slow tapering recovery will unfortunately lead to significantly more cases and deaths from the initial disease surge than predicted by models that assume a Gaussian distribution as there will ultimately be more area under the curve.
Michael Osterholm, a foremost expert on viruses and pandemics who many people saw for the first time on Joe Rogan’s podcast is the Director of the Center for Infectious Disease Research and Policy (CIDRAP). Last week his group at CIDRAP released a report that describes three possible pandemic wave scenarios based on lessons learned from previous pandemics. The first scenario sees one to two years of recurring peaks and valleys similar to what we’ve just experienced requiring periodic reinstitution of mitigation measures like we’re currently living under. For obvious reasons, this scenario could have dramatic economic repercussions. The second scenario mimics the 1918 influenza pandemic which saw an initial peak in the spring and a massive, much more devastating peak in the fall after relaxation of social distancing measures during the summer. This second peak would almost certainly overwhelm our healthcare system and lead to very large numbers of deaths but would not be followed by significant peaks after the fall peak as the virus would have burned through most of the population. The third scenario describes a slow burn after the current, initial surge. In this scenario there are no peaks and valleys, just a constant relatively stable number of ongoing cases and deaths. This scenario would not require large-scale mitigation measures after the initial peak. While this pattern has not been seen with previous influenza pandemics it could occur with a novel coronavirus such as SARS-CoV-2/COVID-19. Whatever scenario plays out, the CIDRAP group advises that Americans should get used to the idea of significant COVID-19 activity for the next 18-24 months. As the pandemic starts to fade away, it’s likely that SARS-CoV-2 will continue to cause less and less severe illness over the next decade eventually settling in as a non-life threatening upper respiratory infection much like it’s other cold-causing coronavirus cousins.
Understanding the difference in deaths due to flu and deaths due to COVID-19 requires an understanding of how the CDC calculates flu deaths annually. Flu is dramatically underreported each year. Some of the reasons for that undercounting include a fairly narrow window for detecting the virus through testing (i.e. even if a patient has flu, the test may not detect the virus if the test is done outside of the window for testing), the fact that older patients who die from flu may never even be tested, and even if tested and positive, death certificates may list associated pneumonia instead of flu as the cause of death.
In order to adjust for this gross undercounting, the CDC uses algorithms based of of actual positives recorded each year in the FluSurv-Net influenza surveillance system to retroactively estimate total numbers of deaths from flu. They start by adjusting the influenza confirmed test-positive hospital deaths to account for under-detection (reasons stated above like false negatives) to arrive at an estimate of influenza hospital deaths. Because not everyone with influenza dies in the hospital, they then look at death certificates to reach a determination of deaths due to influenza that occurred outside of the hospital. They assess multiple causes of death like pneumonia and other respiratory causes and compare those ratios with the actual deaths related to influenza from the FluSurv-Net surveillance system to reach a total disease burden and estimated annual deaths. This is all done retrospectively so data for the current year is generally not available for some time.
This method of determining influenza burden has clear benefits. It’s important for Americans and healthcare workers to understand the cost in lost lives from influenza each year. Because virtually all of us have someone we love who is considered high risk for death from influenza, maintaining high vaccination rates are critical to preventing dramatic increases in deaths. But in a year with COVID-19, this estimated death toll from influenza is problematic and has led some pundits, elected officials and millions of google-trained virologists and epidemiologists to erroneously conclude that COVID-19 is no worse than flu and that a shutdown was/is unnecessary. This, however, is not a valid comparison as no similar algorithm for missed COVID-19 cases is in play. Only actual test-positive COVID-19 cases are counted with a few very specific exceptions.
In an interesting opinion piece in Scientific American, ER physician Dr. Jeremy Faust of Brigham and Women’s and Harvard Medical School suggested that this false comparison and the damage it does to understanding the scope and severity of COVID-19 may necessitate that the CDC move to reporting only test-positive cases of influenza. When Dr. Faust compared the confirmed flu deaths from each of the last seven years with the confirmed COVID-19 deaths of 2020, a clearer picture of COVID-19’s severity became clear.
This year alone, confirmed COVID-19 deaths are nearly 10 times higher than confirmed flu deaths. Dr. Faust also looked deaths for just one week of COVID-19 and compared those deaths to the previous seven seasons of flu.
If we compare, for instance, the number of people who died in the United States from COVID-19 in the second full week of April to the number of people who died from influenza during the worst week of the past seven flu seasons (as reported to the CDC), we find that the novel coronavirus killed between 9.5 and 44 times more people than seasonal flu. In other words, the coronavirus is not anything like the flu: It is much, much worse.
Jeremy Faust, MD/Scientific American
Changing the way we report flu deaths by listing only test-confirmed cases could have serious adverse consequences when it comes to influenza vaccination rates. If Americans see the smaller totals and think that confirmed flu cases are an accurate representation of flu burden they may be less likely to vaccinate. That could have a devastating effect on protecting vulnerable populations from flu in future seasons. Still, during this COVID-19 crisis the apples to oranges comparison of COVID-19 deaths to annual flu deaths has led many Americans to erroneously and dangerously conclude that COVID-19 is no worse than flu. It’s vital that Americans understand the substantial difference and maintain vigilance against COVID-19, evidenced by the extremely unwise increase in mass anti-lockdown protests popping up around the country. As Dr. Faust suggests, the CDC should consider modifying its flu reporting to at least include data for test-confirmed cases with their algorithmic estimates of influenza burden.
Diners in Stockholm during the COVID-19 pandemic. Jonathan Nackstrand/AFP via Getty Images
Sweden’s approach to COVID-19 is different from most countries. Is it working there? Should the US have adopted this strategy? A closer look at the Swedish experience reveals significant problems with the Scandinavian country’s approach andhighlights inherent differences between the two countries that largely prohibit its application in the US.
Facing a novel Coronavirus with a doubling time of around 2 days, most of the world reacted to SARS-CoV-2 with what can only be described as justifiably draconian measures to slow the spread. Absent mitigation and with a doubling time of 2 days, the US would have seen the virus hit every American within about 40 days. America, like most of the world, enacted emergent stay-at-home and social distancing orders and closed non-essential businesses to flatten the curve. Too many infections too quickly would have completely overwhelmed the healthcare system, tragically demonstrated in Wuhan and Lombardy where the virus had a devastating head-start.
Several prominent European countries undertook a different strategy. England, the Netherlands and Sweden instituted what is considered a herd-immunity approach. While it’s important to note that England and the Netherlands had to abandon this blueprint when cases and deaths started climbing, Sweden has largely stuck with the plan. The idea behind this is that in the absence of a vaccine, the only way to move on from a virus like this is to allow herd-immunity to develop. The purest form of this approach would be to just let the virus burn through a population and allow everyone to become infected, but at the cost of thousands of lives and an overwhelmed healthcare system. Sweden didn’t go that far but instead attempted to find a middle-ground. They executed a much less restrictive approach than other nations and allowed businesses, restaurants, bars, and gyms to to stay open while enacting certain social distancing rules for the owners and patrons to follow. The Swedish government, instead of stay-at-home orders, recommended that Swedes voluntarily enact social distancing by working from home and keeping an arm’s length distance when around others. It’s somewhat like a controlled burn approach with the goal of keeping the virus down to about 30% of its normal spread while focusing on the protection of vulnerable populations.
On the surface, Sweden’s approach seems to be working for them. Without enacting strict, often unpopular laws, Sweden has effectively flattened the curve and prevented a hospital crisis. The government believes that in Stockholm at least, a significant portion of the population has been infected and that they may be closing in on herd immunity but this is a projection without solid data confirmation as comprehensive serology testing has not yet been fully undertaken. Results in Sweden have led some here in the United States to suggest that Sweden is evidence that the response to COVID-19 has been an overreaction to a virus that is not as severe as experts would have us think and that Sweden’s strategy should have been adopted here to soften the economic blow.
Let’s take a look at the Swedish experience to see whether these claims have merit and whether they could have been successfully adopted in the US.
First I think it’s important to determine whether their approach is as different as it seems. While there’s no stay-at-home order in Sweden, there are public health orders in place to increase social distancing. High schools and colleges were closed, gatherings of over 50 people are prohibited, in restaurants and bars, patrons must maintain arm’s length distance from one another. Instead of orders, Sweden called on its citizens to voluntarily enact social distancing principles. The population was asked to work from home, avoid unnecessary travel and maintain distance from others. Swedes seem to have largely adopted these measures. Data suggests that movement in the streets of Stockholm was down to 30 percent of normal, a number that in many cases surpasses US reductions in movement even in the regions most compliant with mandated stay-at-home orders. Upwards of 50% of Swedes transitioned to working from home and use of public transit dropped in half as well. Even vacations have been canceled with 85% of Swedes reporting that they would not be taking the usual annual pilgrimage to the resort island of Gotland.
Whether mandated or not, a voluntary stay-at-home policy is still a stay-at-home measure. Swedish ideology is rooted in a deep respect for social justice. Heba Habib at the Christian Science Monitor who has followed the Swedish experience with COVID-19 reports that Swedes take great pride in their personal responsibility. The idea of breaking the social contract of social distancing by holding a mass gathering or flocking to the beach at the first sign of sun would be flatly rejected by Swedes.
Sweden promotes itself as being a model society based on values of social justice and human rationality, with a high level of trust between people and trustworthy authorities. This has its origins from the Social Democrat-introduced concept of “Folkhemmet,” or people’s home, where a welfare state cares for all with the proviso that everyone complies with a communal order.
Heba Habib/Christian Science Monitor
In effect, Swedes largely trust their authorities to do what’s best for the people with respect to COVID-19 and in return they have generally complied with voluntary COVID-19 orders when asked to do so by their government. The Swedish experience with COVID-19 has been reliant on this trust in government and the importance of maintaining the social contract. Though falling somewhat in recent years, the OECD index on government trust shows Swedes trust their government quite a bit more than Americans do. For the Swedish approach to work in the US, Americans would have to show the same willingness to take the governments assessment of virus severity and subsequent social-distancing recommendations as truth and follow them without legal mandate to do so. Americans suggesting that Sweden’s approach should be ours, must honestly answer if it is part of US national identity to trust and comply with government in this way.
Trust in government: Sweden–56%, US–35%/OECD
So has the Swedish approach worked? If the only metric by which you measure success is flattening the curve to prevent overwhelming hospitals, then yes, Sweden has succeeded for now. It’s possible that Stockholm has peaked though data is not yet conclusive and it is too early to tell if the nation has peaked. Youyang Gu’s universally praised, highly predictive model estimates an overall infection rate of about 5% in Sweden; that is nowhere near numbers needed for herd immunity. It would seem there are still a lot of people left for the virus to burn through.
What about their deaths? Have they protected the people from dying, particularly the vulnerable? If this is the metric of success, then Sweden’s approach has not been particularly successful. Deaths in Sweden are proportionately higher than their Scandinavian neighbors who enacted stricter social distancing measures.
Total deaths and Deaths/Million People/John’s Hopkins
These deaths have hit vulnerable populations in Sweden hard. About 50% of all deaths in Sweden have occurred in elder care facilities. One of the goals of the Swedish approach was to protect these vulnerable populations; in that they have not been particularly successful. If your metric for measuring success is preventing death, particularly among the vulnerable, then Sweden has come up short.
One of the arguments made here in American by people opposed to the social distancing orders is the effect these measures have on the economy. They point to Sweden as an example of a country that has been able to keep its economy open in spite of COVID-19. If we take a closer look at their economy, however, Sweden is not fully escaping the toll this virus has taken on other nations with more aggressive lockdowns. The Swedish Finance Minister projected that the economy would shrink by 7% which was a worsening of previous projections. This contraction is similar to the projected contraction in the Netherlands and depending on how the virus behaves, could be as much as 10%. Unemployment is expected to reach 11%. That’s certainly better than the US’s expected 20-30% unemployment. It’s important to remember, however, that the Swedish government helps to prevent unemployment by giving employers money to keep people on payroll. To compensate for reduced employee hours and business productivity losses, employers are permitted to cut salaries but the government then supplements employee pay up to 90% of original salary. The US has attempted to pass legislation that similarly protects jobs by providing forgivable loans to businesses who keep people on the payroll. The roll-out has been fraught with problems and the money quickly dried up before most could benefit. Businesses have had to let people go while waiting for assistance, driving up unemployment rates. The US focus has been to provide one-time payments to most Americans and to bolster the unemployment benefits system. Sweden’s very different approach is of course paid for in part through a very different taxation strategy than in the US. The top statutory personal income tax rate in Sweden in 2018 was 57% and applies to all earners who are making 1.5 times the national average and in the US, the top rate of 43.7% applies only to people who make over 9 times the national average. I bring this up not to advocate for a Swedish welfare state or for the US to adopt the Swedish system of taxation. It is, however, important to consider the apples to oranges differences in Swedish and US economic strategies when suggesting that adopting the Swedish approach to COVID-19 would work in America or that we would see the same economic benefits.
There are other factors which make the Swedish experience somewhat unique and difficult to apply elswhere. Their population density is significantly lower and they have far less travel into the country than their harder hit neighbors in Europe. Inbound tourism is dwarfed by countries like Spain, Italy and France and the US. According to the World Tourism Organization, in 2017, Sweden had 7M inbound tourists compared with almost 77M inbound tourist to the US. With fewer people traveling into the country, Sweden was able to avoid massive importation of the virus making their initial contact tracing efforts exponentially easier to manage.
So this has all been a long-winded way of saying that Sweden’s approach is not the panacea some in the United States claim. In fact, 22 of Sweden’s top research and infectious disease scientists recently wrote an op-ed in a national newspaper calling on the government to enact strict social-distancing and stay-at-home orders matching other nations. They’re concerned about Sweden’s high number of deaths and continuing increases in new daily cases, especially in vulnerable populations. As they see it, Sweden is headed for a disastrous surge in cases which could soon overwhelm their healthcare system.
I can’t say that Sweden has been completely wrong-headed about their approach. It’s simply too early to tell. The world should study their model and learn from it to see if it ultimately demonstrates a benefit. A comprehensive review of all the factors that contribute to a nation’s success or failure in the fight against COVID-19 is far beyond the scope of this blog post and, frankly, beyond the knowledge of its author. My goal here is to simply point out that fundamental differences in our two countries make for difficult comparisons and tougher still, conclusions. The idea that the Swedish experience proves the public health response in the US was an overreaction to an overhyped virus is unsupported by the facts. It’s also folly to suggest that the Swedish model, not yet shown to be successful even in Sweden, would work in America. The differences between our two countries both physically and temperamentally are vast. Ignoring these fundamental differences and assuming that the Swedish approach to COVID-19 would be successful if adopted here is woefully naive even if politically expedient.
Time will tell if the Swedes have successfully ridden the wave of COVID-19 into herd immunity without the need for government orders, or if all they’ve done is push their peak down the road a bit and that dark days lie ahead for them.
This is a common and somewhat understandable refrain in recent months. Is the damage to the economy caused by public health interventions like social distancing and shelter-in-place worse than the potential damage of COVID-19 itself? Is the cure worse than the disease? How can we know?
“The farther backward you can look, the farther forward you are likely to see.”
Winston Churchill
History can help us if we’re willing to learn from it. Several economists have taken a bite out of this problem with very interesting results. Prof. Emil Verner from the MIT Sloan School of Management along with Dr. Sergio Correia and Dr. Stephan Luck from the Federal Reserve have done what more of us should do–learn from history. Together these economists studied social distancing practices or non-pharmaceutical interventions (NPIs) from the Spanish Flu of 1918 to evaluate the effects of social distancing on the economy. Their paper is not yet peer-reviewed but it provides some compelling insights into the efficacy of public health interventions in a pandemic and the resulting economic impacts.
The 1918 influenza pandemic is thought to have infected nearly a third of the world’s population at the time or 500 million people. In the United States alone, 675,000 people died, worldwide–50 million. It was caused by an H1N1 virus with genes of avian origin. Public health measures at the time were focused on prevention of spread from person to person. Those infected were prevented from breathing the same air as the uninfected. Public health guidelines and interventions at the time included prohibiting mass gatherings, banning non-essential meetings, closing dance halls, bars and cinemas, and some encouraged staggered work times to prevent unnecessary congregation. All pretty familiar stuff today, right? Like today, the degree to which these recommendations were followed varied widely throughout the country.
Policemen in Seattle wearing masks during the 1918 Influenza pandemic/National Archives
What Verner, Correia and Luck found was that, as expected, higher mortality in a region led to greater economic depression. More than that though, they looked at American Cities’ response and compared the economic impact of municipalities who enacted strict social distancing measures with those who enacted much weaker measures. Here they found that cities who enacted the strictest social distancing measures had lower mortality but they also experienced the greatest economic growth. Simply put, cities that were committed to public health measures like social distancing had fewer deaths and better economic outcomes.
The green-dot cities in the upper left who enacted strict NPIs like social distancing over longer periods had lower mortality and higher economic growth whereas the red-dot cities in the lower right, who were more lenient with NPIs, experienced higher mortality and stunted economic growth. The authors say it best.
Comparing cities by the speed and aggressiveness of NPIs, we find that early and forceful NPIs do not worsen the economic downturn. On the contrary, cities that intervened earlier and more aggressively experience a relative increase in manufacturing employment, manufacturing output, and bank assets in 1919, after the end of the pandemic.
Emil Verner, Dr. Sergio Correia and Dr. Stephan Luck/Pandemics Depress the Economy, Public Health Interventions Do Not: Evidence from the 1918 Flu
The economic impacts of this pandemic on families and businesses has been devastating. Public health measures like shelter-in-place and social distancing are a bitter pill to be sure. History tells us, however, that this medicine, while hard to swallow, gives us the best chance of surviving, both medically and economically.
Future generations will study this moment, perhaps as they face their own crisis. Just like us they’ll be looking for clues from the past about how to survive. Will they see ancestors rooted in solid science with an unwavering commitment to public health, or will they see a fleeing from science and reason when things got hard? I’m not sure.
The National Institute of Allergy and Infectious Diseases (NIAID) released a statement today indicating that preliminary data from a government-run study of Remdesivir shows that the drug appears to reduce recovery time by 31% (median of 4 days) in patients with advanced COVID-19 disease and lung involvement. It may also have a benefit in mortality though it sounds like that’s less clear. The Remdesivir group had a mortality rate of 8% compared with 11.6% in the placebo group–this, however, did not reach statistical significance.
It definitely falls short of a home run but it’s very good news especially in light of the recently released study from Wuhan China which seemed to show no statistically significant difference between a Remdesivir group and a placebo group. The Chinese study, a double-blind, placebo controlled, multi-center, randomized trial was well designed but it never reached its goal of 453 patients, topping out instead at 237 patients. By March 12 there weren’t enough patients in the region who met the study’s criteria for inclusion. That resulted in an underpowered study and the authors themselves reported this limitation. In effect, if you aren’t able to study a large enough group, your findings may not reach statistical significance–meaning there’s too much of a possibility the findings are a result of chance, whether the medication looked to be beneficial or not. For what it’s worth, the Chinese study suggested a small benefit from Remdesivir.
The NIAID study–also a randomized, controlled trial–looked at 1063 patients with advanced COVID-19 and lung involvement and randomly placed them into either a treatment or a placebo group. The positive results from a study with significantly more power than than the Chinese study will likely lead the FDA to issue an emergency authorization for use of Remdesivir in treating COVID-19, at least for critical patients, since they previously did the same for the anti-malarial drug hydroxychloroquine which had much less evidence supporting its use.
Bear in mind the study data has not been released, only the statement from the NIAID so deep review and analysis is not yet possible. We should always be cautious until the typical scientific process plays out in full.
A week ago Drs. Dan Erickson and Artin Massihi shared data from their regional urgent cares that seemed to indicate that SARS-CoV-2 had spread much further in their region than testing would indicate and that it was therefore much less dangerous than thought. They went so far as to say that the stay-at-home order is unnecessary and that people should get back to work.
“Do we need to still shelter in place? Our answer is no. Do we need businesses to be shut down? No. Do we need to test them and get them back to work? Yes we do,”
Dr. Dan Erickson.
The best critique I’ve seen of their study came from Dr. Carl T. Bergstrom, a University of Washington biologist who specializes in infectious disease modeling. Here’s a transcript of his response with a link to the actual series of tweets below.
“What they did was simple: they looked at the fraction of patients who tested positive for COVID-19 at the clinics they own. They found 340 out of 5213 tests were positive, about 6.6.%. They assume the same fraction of the whole population are infected. From there, they scale up to the state level and claim 12% incidence statewide. The news story says it is using the same calculation, but it can’t be–how did they get from 6.6% to 12%? Perhaps they estimating [sic] infected *ever* versus infected *currently*. It is not clear.
Using that 12% infected figure, and a known 1400 deaths in California, they assume 1400 out of 4.7 million have died. That gives them an infection fatality rate of 0.03%. That is they think that if 10,000 are infected, 3 will die on average. The problem with this approach is that during a pandemic, the people who come into an urgent care clinic are not a random sample of the population. A large fraction of them are coming in precisely because they suspect that they have the disease.
This generates sampling bias.
Estimating that fraction infected from patients at an urgent care facility is a bit like estimating the average height of Americans from the players on an NBA court. It’s not a random sample, and it gives a highly biased estimate.
Moreover the estimate does not pass even a basic plausibility check. In New York City, 12,067 people are known to have died from the virus, out of a population of 8.4 million. This is a rate of 0.14% of all people. Not just infected people. All people. That gives us a lower bound on the death rate in New York. Not an estimate, a lower bound. The death rate for infected people is obviously higher than 0.14% because not everyone in New York has been infected. And yet that 0.14% lower bound is nearly *five times as high* as the 0.03% that the Bakerfield [sic] duo are claiming. They’ve used absurd methodology to arrive at an implausible number.
If the pandemic were not so severely politicized, this would be a non-issue from the start.
The docs from Bakersfield made a common statistical error by not studying a random sample of the population. If you’re going to use sample data to draw conclusions about the total population, you’d better make sure your sample is representative of the total population. It’s easy to get wrong even if you’re trying hard to get it right. Had they utilized a tool (e.g. random digit dialing) to find representative members of their community and schedule that random sample of people for testing they’d have come a lot closer to creating an actual study. Instead, they injected an almost humorous level of bias into their study by choosing a sample certain to have a higher infection rate than the total population–quite a bit higher as they’re coming into an urgent care, you know, sick.
The American College of Emergency Physicians and the American Academy of Emergency Medicine weren’t laughing however when they issued a joint statement on the matter.
The American College of Emergency Physicians (ACEP) and the American Academy of Emergency Medicine (AAEM) jointly and emphatically condemn the recent opinions released by Dr. Daniel Erickson and Dr. Artin Massihi. These reckless and untested musings do not speak for medical societies and are inconsistent with current science and epidemiology regarding COVID-19. As owners of local urgent care clinics, it appears these two individuals are releasing biased, non-peer reviewed data to advance their personal financial interests without regard for the public’s health.
COVID-19 misinformation is widespread and dangerous. Members of ACEP and AAEM are first-hand witnesses to the human toll that COVID-19 is taking on our communities. ACEP and AAEM strongly advise against using any statements of Drs. Erickson and Massihi as a basis for policy and decision making.
AAEP/AAEM Joint Statement on Physician Misinformation
I’m going to give these two docs the benefit of the doubt and assume that they just made a huge mistake for which they are embarrassed. I’m going to assume that they weren’t actually trying to put their own financial wellbeing ahead of the public’s health. I’m going to assume they did not have a political agenda when crafting this mess of a study.
I think it’s important for my own peace of mind that I do that.
For some time I’ve been considering leaving Facebook. While there are many positive aspects of the social media giant, there are some things about it that I find hard to stomach. It’s a great place to share photos of family and pets and jiu jitsu, but it’s a terrible place for conversations. The world is polarized and so is Facebook, actually, the world may be polarized because of Facebook. I love to talk science though. Writing about COVID-19, while not a cheery subject, has helped me process some of the feelings I have about living through it, especially as a public health physician, worried father and husband. I just want to do it more on my terms. No yelling, no anti-science comments, just people who want to understand what on earth is happening right now with the best tool the human race has ever devised for understanding our world. So welcome to my new home!
Thoughts on COVID-19
Nationally there’s a bit of a worrisome trend with our doubling time. A while back, on Facebook, I mentioned the good news that our national doubling time was increasing and that it was increasing by more than a day, every day. That signifies a peak in terms of new daily cases. The daily increase in doubling time was actually increasing along a sloping curve meaning something approximating an accelerating growth curve. That’s not happening anymore. What we see now is more of a plateauing of our doubling time. It’s been stuck increasing at a rate of about 18-20 hours a day for a week or so–every day our doubling time is increasing by the same amount, 18-20 hours. It’s no longer accelerating. There are a couple reasons for why that might be happening. Some are okay, some are not. It’s possible that regional and state differences in the timing and slope of the COVID-19 curves are making it so that later peaking states are rising while earlier peaking states are waning. That could be okay. It just means we’re all marching to the beat of our own drums and eventually we’ll all start a collective increase in our doubling time rate together. It also could mean that people are slipping with their social distancing and stay-at-home compliance. Spread of infection during recent protests along with religious ceremonies for Easter and Passover could be putting the brakes on our ride away from the peak. More time will tell. For all sorts of great information on the national doubling time, visit https://www.danreichart.com/covid19 He runs one of my favorite statistical sites for COVID-19 and most of my US doubling time information posted to Facebook and now here comes from his great work. His approach is to look at each day anew. Here’s where we are today and this is what we’ll look like in the future if our doubling time stays what it is today.
And now some pretty good news. Scientists from the the Jenner Institute at Oxford have been working on a vaccine. What makes this good news is that it’s a vaccine they made some time ago as a possible vaccine for MERS and they’ve already tested it for safety–last year actually. Safety testing can be one of the longest steps in the process of making a good vaccine. You have to watch people for quite a while to make sure they don’t have any lingering adverse effects–sometimes several years. Having something ready to test for efficacy is a big head-start. The vaccine has recently been tested in rhesus macaque monkeys with good results. Six monkeys were given the vaccine and then exposed to a large amount of the virus. All six are still healthy a month out. Testing in monkeys doesn’t guarantee success in humans but the rhesus macaque is just about the closest thing we have to humans. Given that, testing in humans is likely to happen sooner rather than later. If all goes well (that’s a gigantic IF), and the Institute is given emergency approval, they could have several million doses available as early as September. That would be monumental. Please remember there are still massive efficacy hurdles to jump so take a deep breath and in a very unscientific way, maybe cross your fingers.
With this pandemic, the rush to find an effective treatment has been fully understandable. I posted early about the possibility that hydroxychloroquine might be an effective treatment based on some very small, and it turns out pretty flawed, studies. Newer (also small, also not peer reviewed) studies out of Brazil and the VA system in the US indicate that hydroxychloroquine is ineffective in the treatment of COVID-19 and possibly dangerous (the trial in Brazil was stopped when some of the patients in the high-dose arm of the study developed lethal cardiac arrhythmias). The efficacy and safety of hydroxychloroquine to treat COVID-19 should be established in large, controlled studies and it should not be provided as an off-label treatment for the virus in a non-study setting. There, I said it. Good science takes time and patience. But nobody’s listening to me.
Look to hear from California’s Governor Newsom sometime in the next 48 hours regarding details about relaxation of the stay-at-home/social distancing orders. California’s actions have made a difference. As we’ve known for a century at least, social distancing works and it worked here. While the initial orders were emergent and broad-sweeping, look for the relaxation orders to be more surgical and to come with a period of evaluation. We needed quick, blanket action to prevent massive spread of the virus through the entire population of California when it was doubling every two days. With a doubling time of two days, the virus would have hit everyone in America within about 40 days. Now that we’re much more under control we can relax elements of social distancing one at a time with a period of observation to look for spikes. We can then see which of these measures were the most important in preventing spread of this virus. This process will give us valuable data and will help us in the fall when it’s likely the virus will surge again. Our break from the lockdown may not be as soon as we’d hoped though. This past weekend, some Californians jumped the gun and flocked to the beaches in numbers that are simply unwise at this point. This was a mistake and may very well lead to an uptick in the virus within the next two weeks. It’s just simple virology. If that happens we may not get our relaxation phase as soon as we would have, had people maintained social distancing per state and local public health department orders. Here’s hoping we don’t see that or that what we see isn’t enough to derail our break from the lockdown.
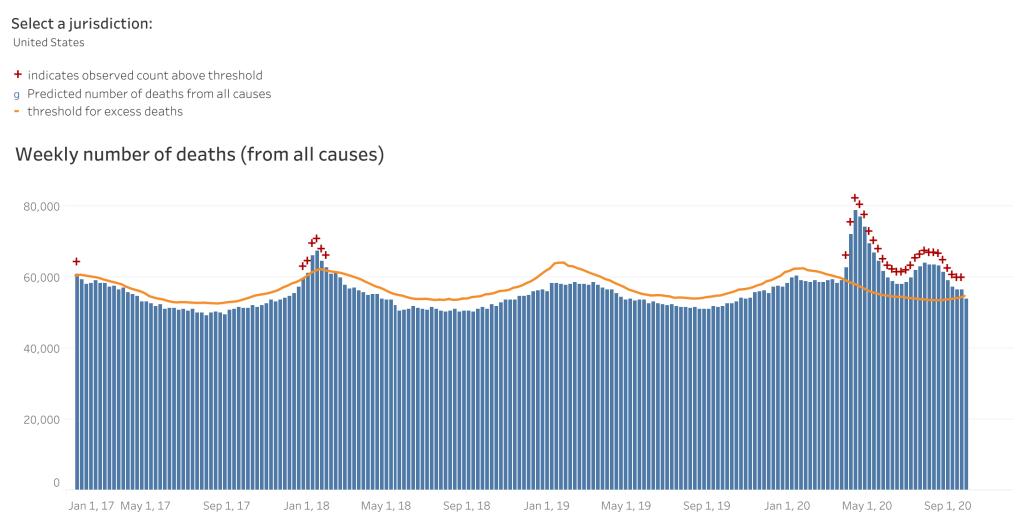

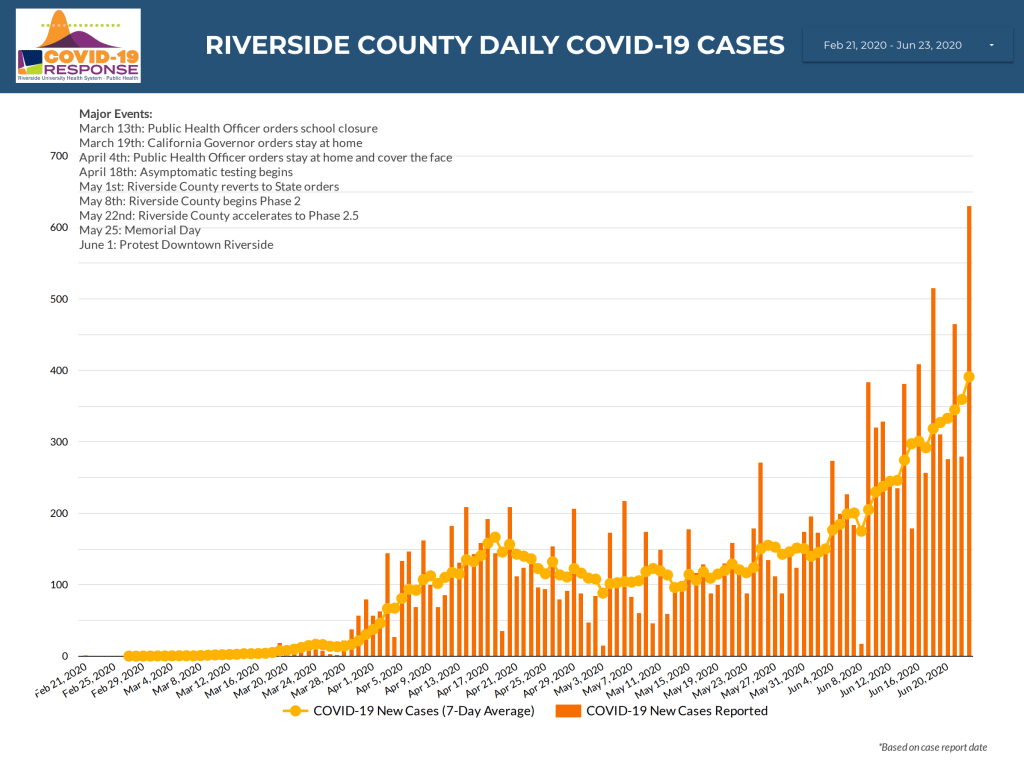

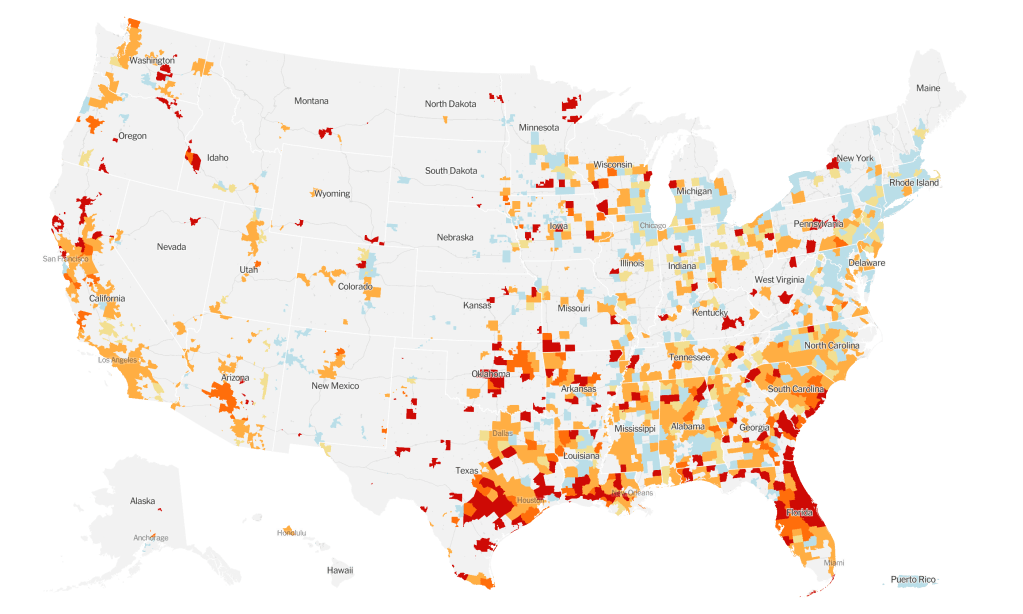
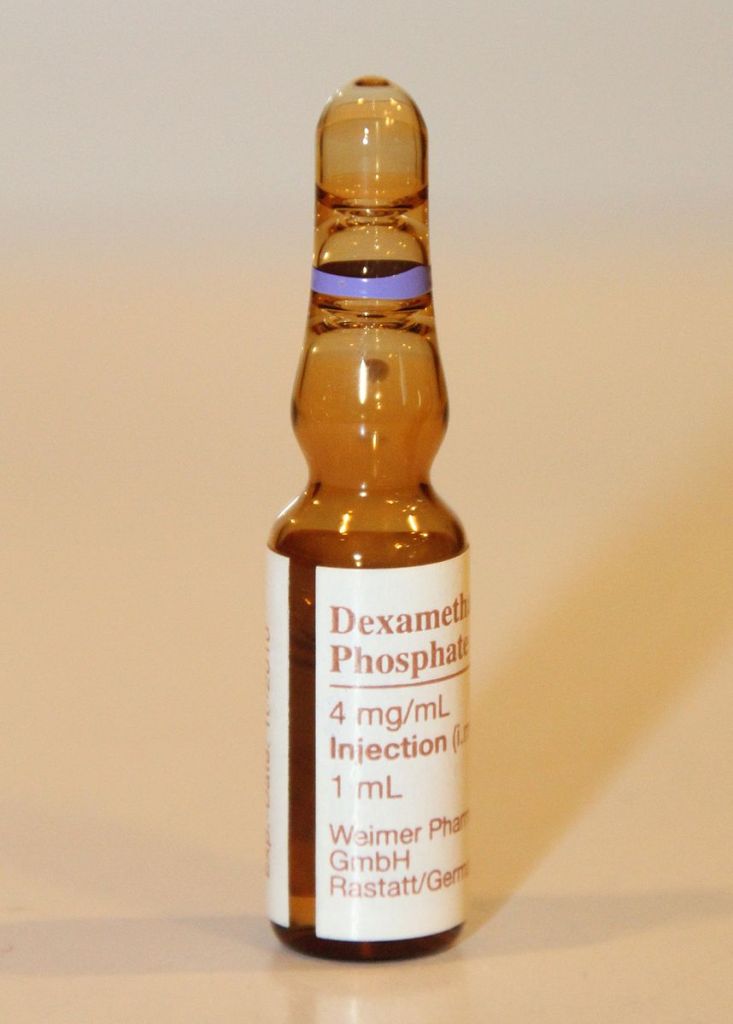
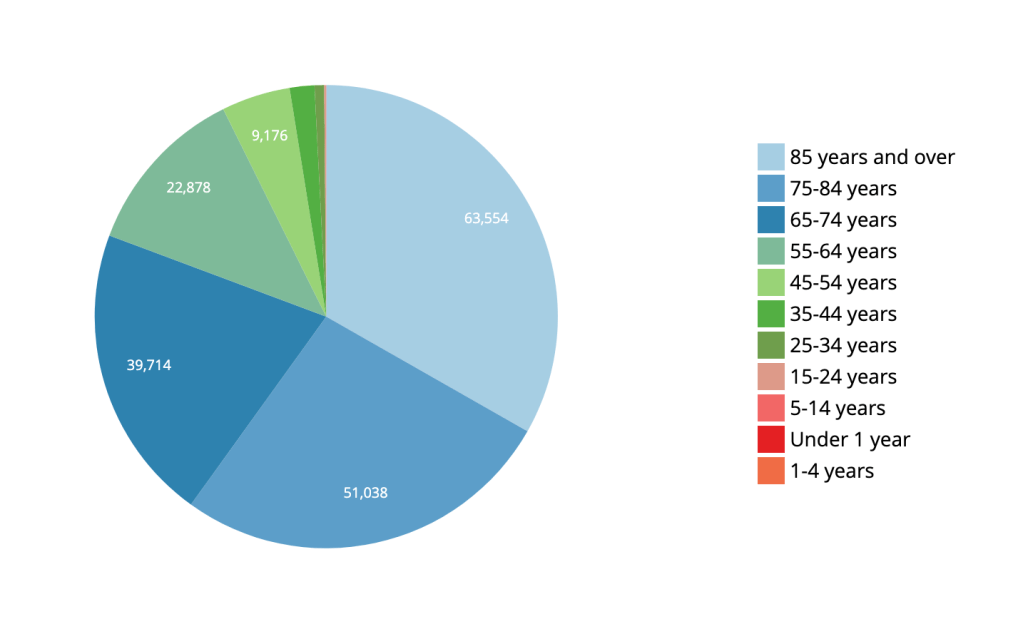

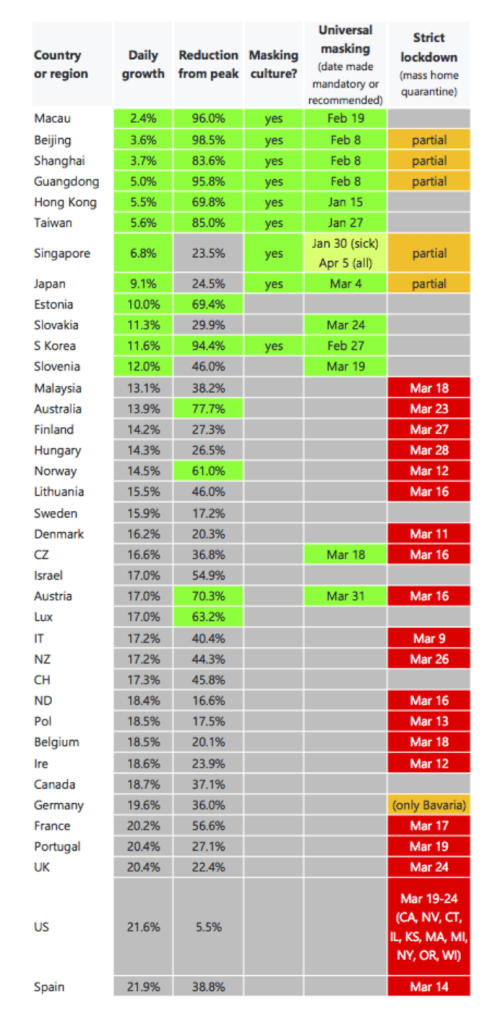


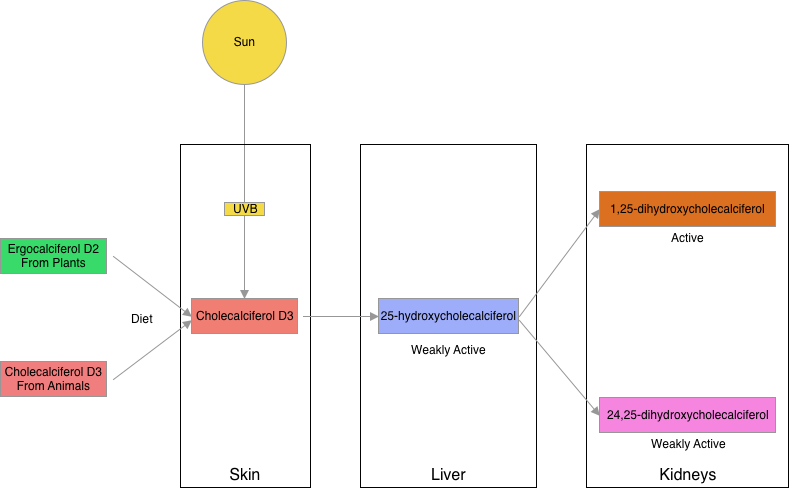
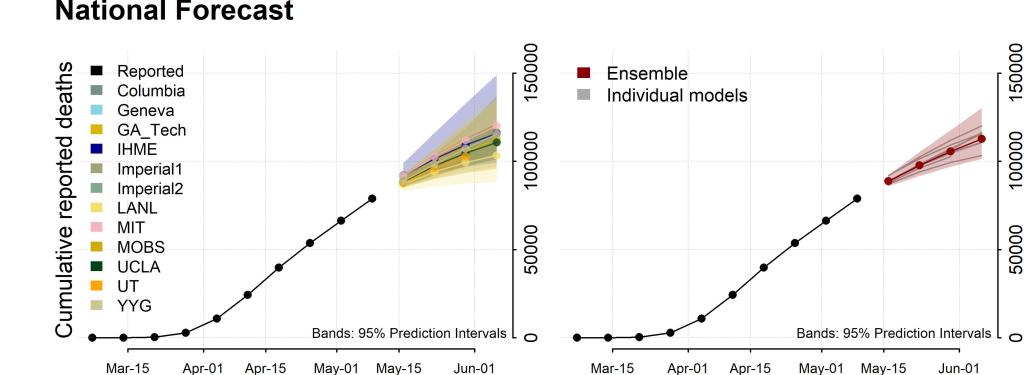
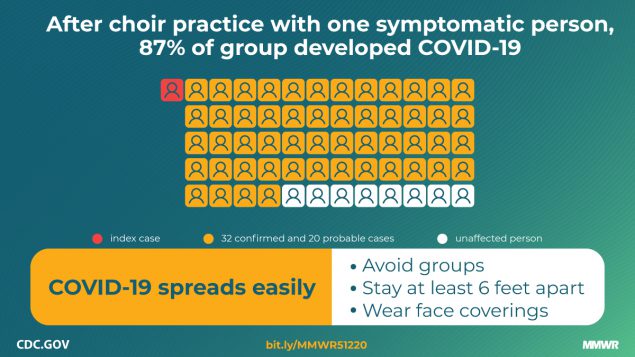


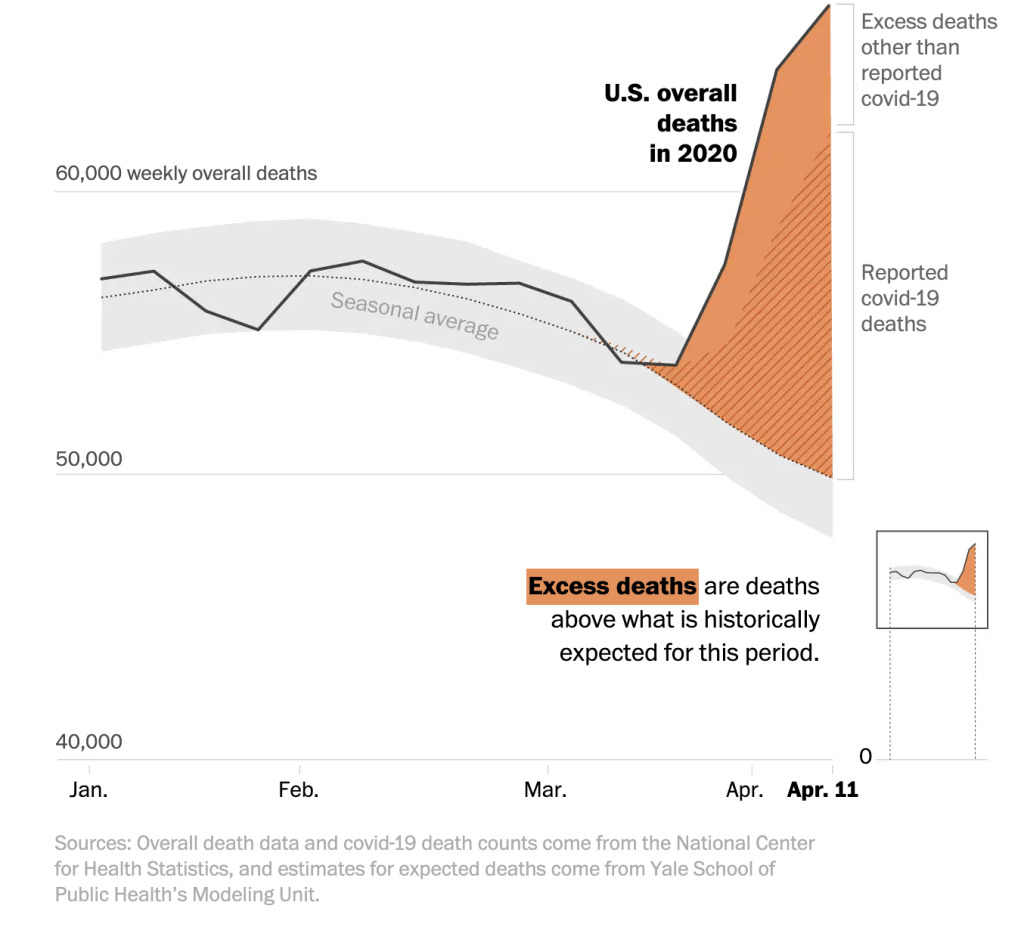


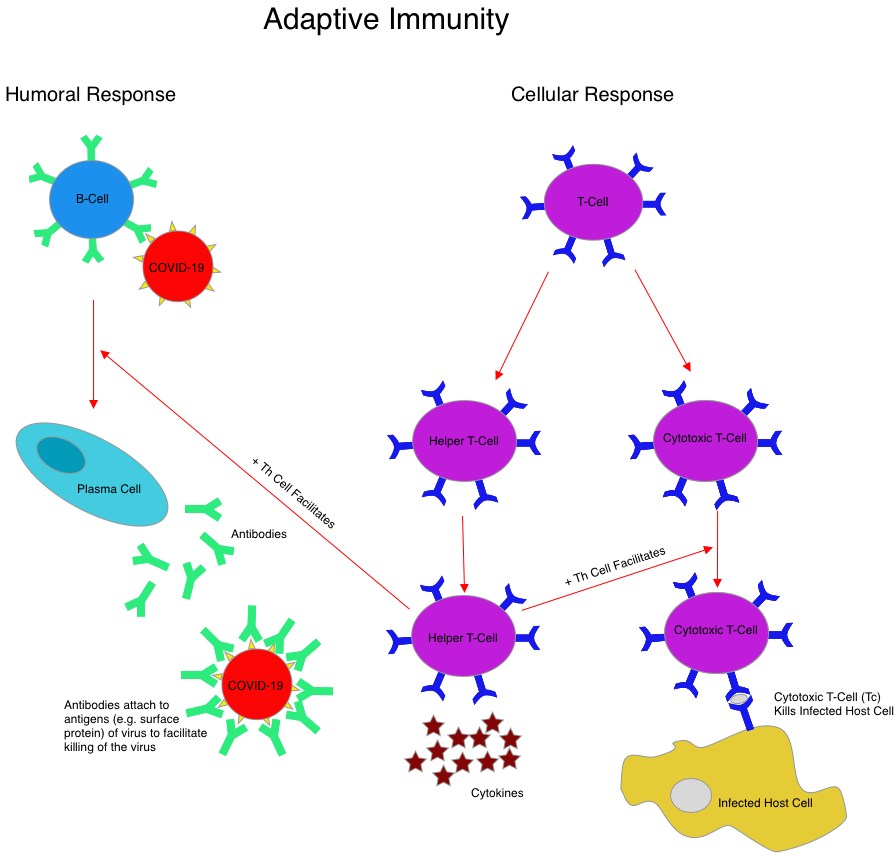

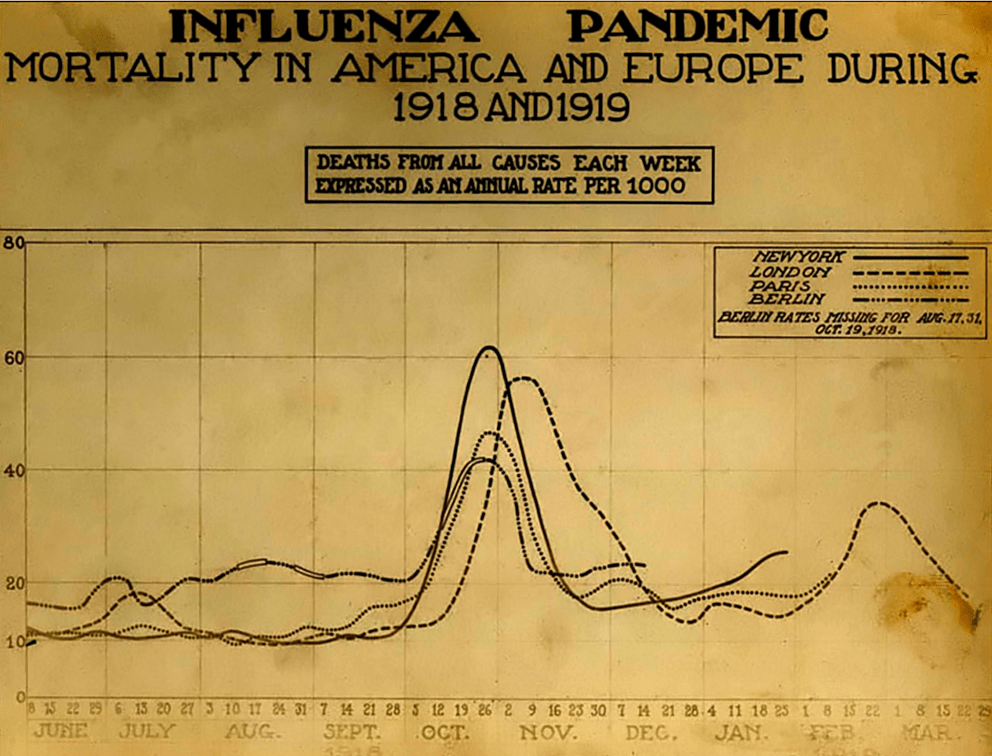


:format(webp):no_upscale()/cdn.vox-cdn.com/uploads/chorus_asset/file/19885359/1208432585.jpg.jpg)

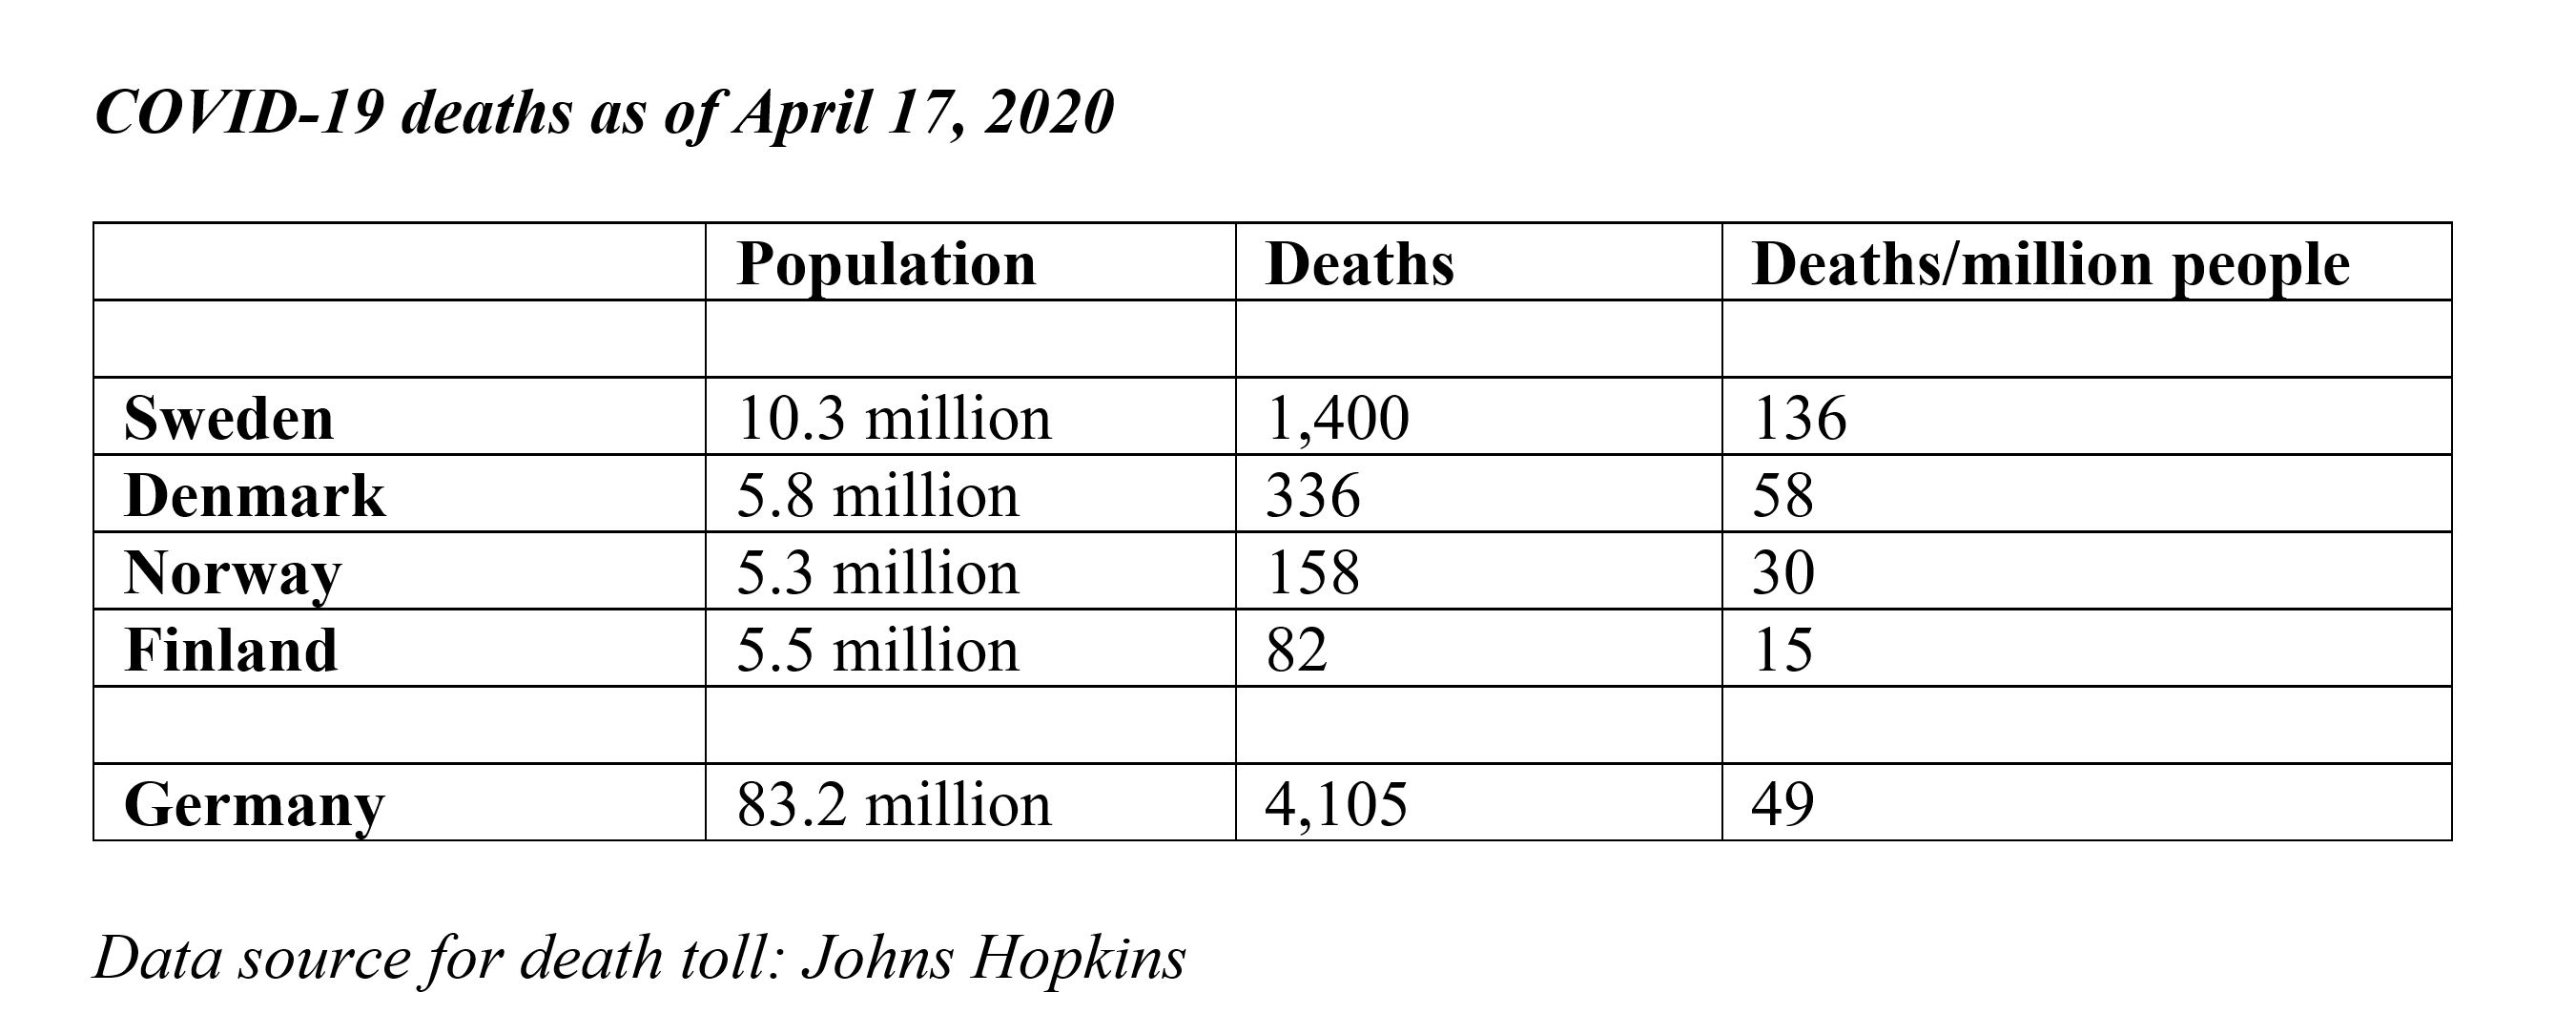


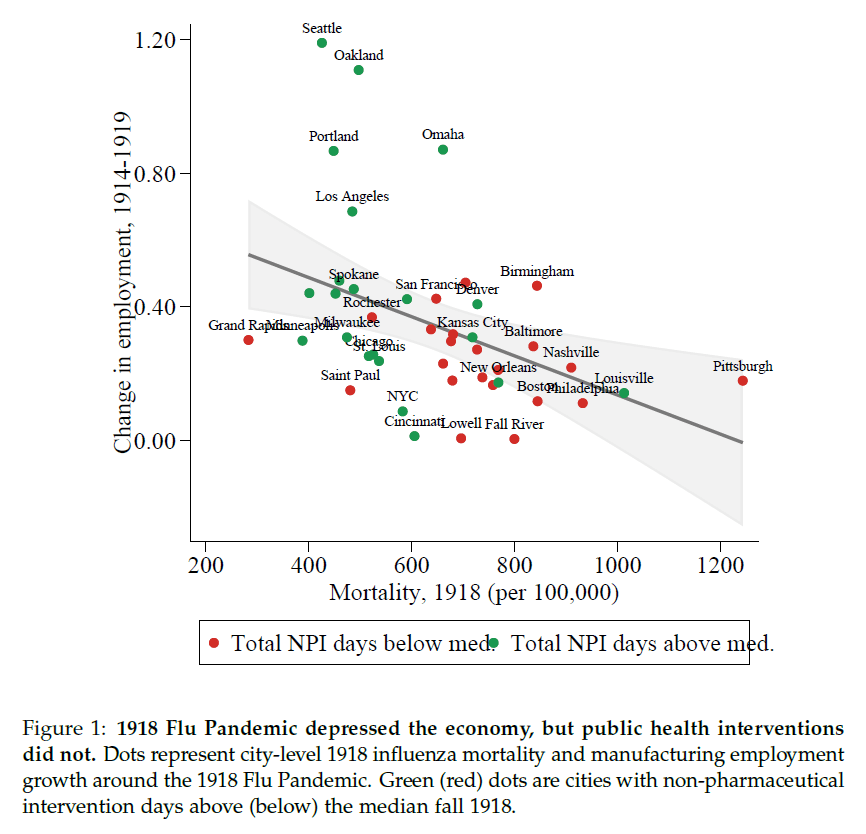

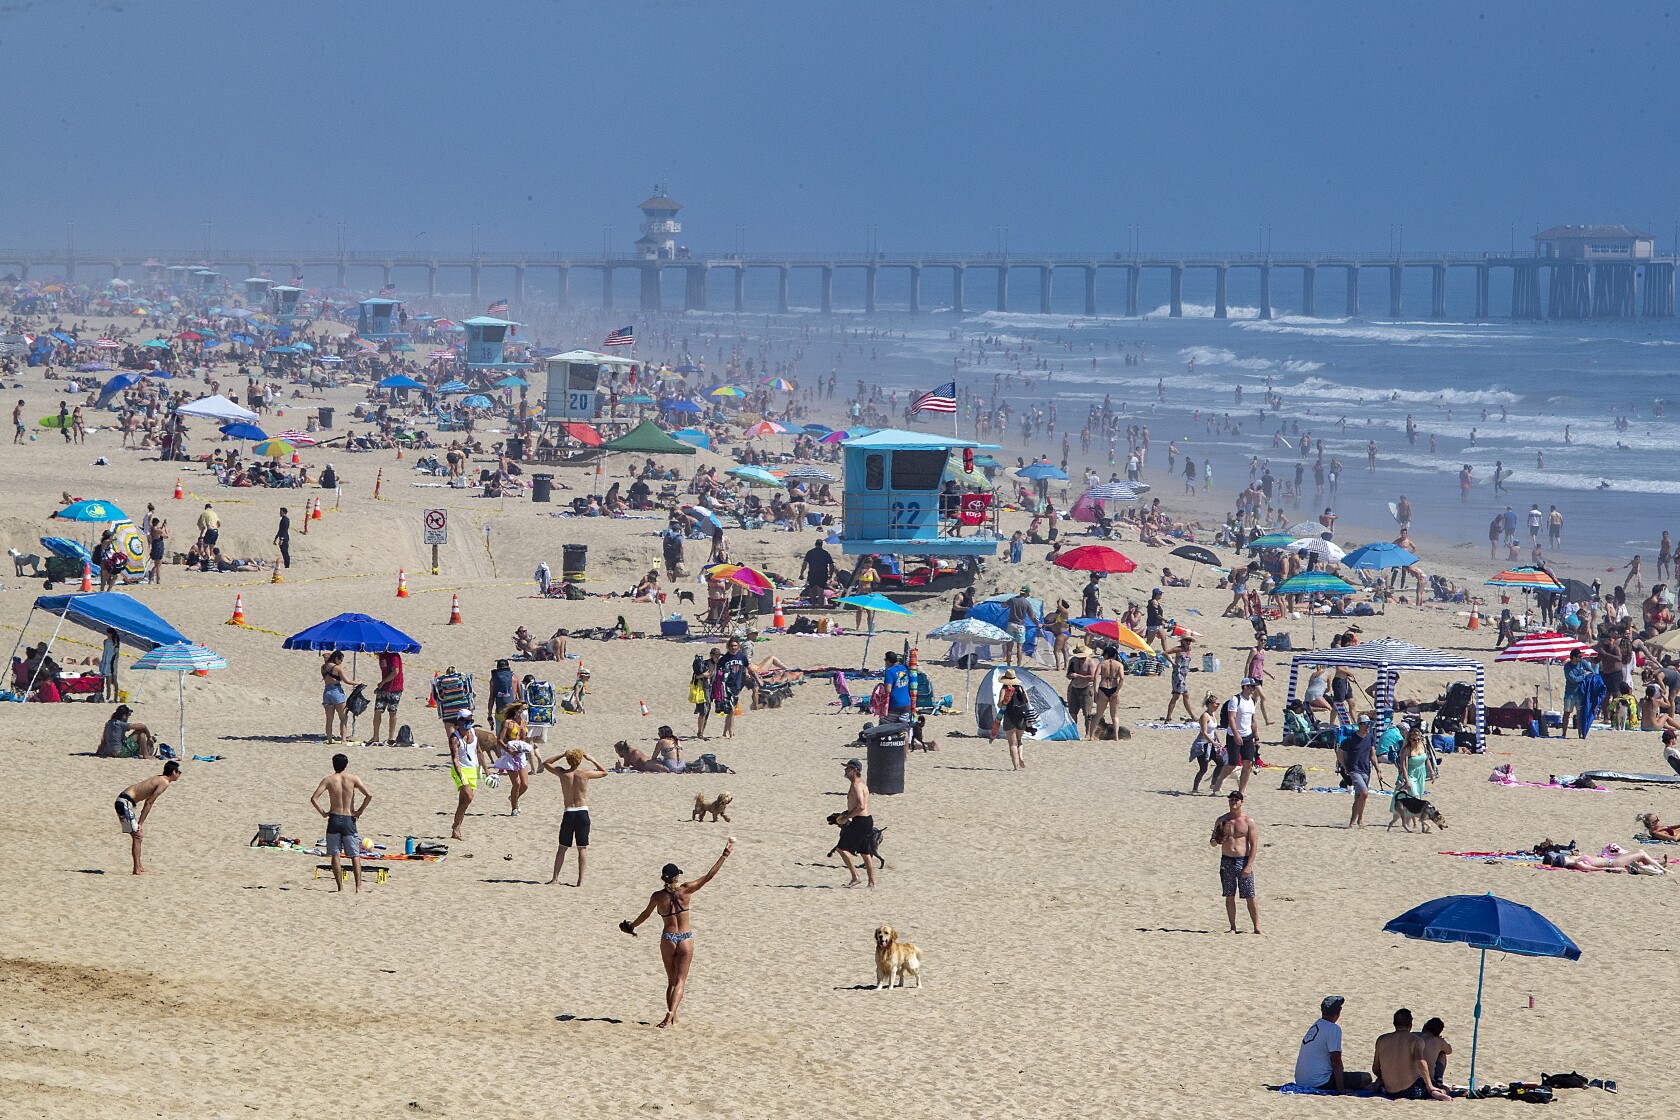
