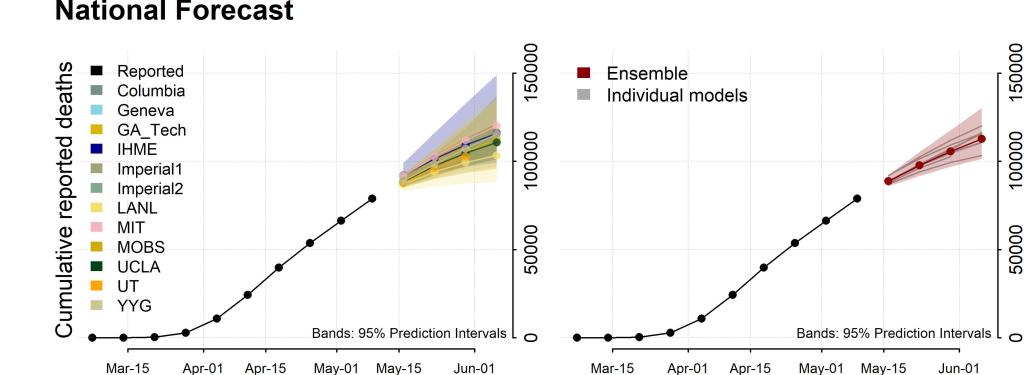
The National Ensemble Forecast analyzes data from 12 different models to created an ensemble forecast/CDC
Predictive models for US deaths are beginning to coalesce around a projection of 110,000-115,000 deaths by June 6. By August 1st we’re looking at around 180,000 deaths.
Youyang Gu has used the data from his incredibly accurate COVID-19 model to calculate Infection Fatality Rate (IFR) of about 1% for the virus. The IFR is difficult to know during a pandemic and may not be fully fleshed out for years. The IFR is the percentage of people who die out of the total number of people who are infected (whether or not they are test-confirmed or symptomatic). Because we won’t know this data for some time the IFR is elusive during a pandemic. What Gu has done is use the accuracy of his model as a starting point and reference and then calculated curves based on IFRs from 0.2-1.5%. The IFRs that had the smallest variance from his curve came in around 1% (0.9-1.2). This is similar to other estimations of IFR from New York data which come in at around 0.91%. It would appear from these estimates (and make no mistake, they are estimates) that COVID-19 is approximately 10 times more deadly than flu–basically the estimate Dr. Fauci gave to Congress during his testimony. The Case Fatality Rate (CFR) is much higher than the IFR because it is a measure of deaths out of the total number of confirmed cases (e.g. only those cases that have tested positive for the disease and not the untested or the asymptomatic) and the mortality rate is lower because it is a measure of deaths as a part of the total population (i.e how many people died from a disease out of the entire population of the US). The term “mortality” is often used familiarly to describe the IFR and sometimes the CFR but it is important to know that they are all actually different measures of death due to disease. It should be noted that to focus solely on deaths in a pandemic is a myopic approach and doing so does not reveal a fully accurate picture of disease severity.
Cases in Orange County are increasing week to week (441-664-787) following the crowds converging on the beaches on April 25th and 26th. It’s concerning but at this point it’s nothing more than correlation; it’s not known if the crowding caused these increases. If a link exists, contact tracing may reveal it. The increase in cases could be related to an increase in testing as well as OC has been lagging behind other counties in the region. The increases in recent weeks could also merely be a statistical aberration and numbers could soon fall. It will be important to follow OC’s numbers either way as it has been a gathering point for people seeking the sun and, in some communities, for people protesting stay-at-home orders.
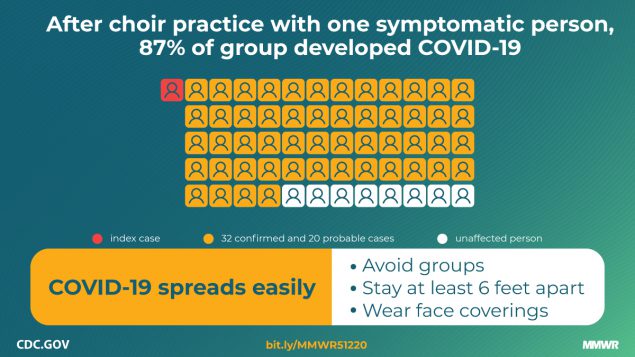
CDC graphic shows spread through 87% of choir practice participants from one symptomatic individual/cdc.gov MMWR
The Morbidity and Mortality Weekly Report (MMWR) by Lea Hamner et al. released today describes the impressive spread of SARS-CoV-2 from one symptomatic individual to 53 (33 confirmed and 20 probable) out of 61 members of a choir in Washington State. Of those infected, two eventually died.
The report startlingly illustrates some important phenomena related to rapid viral spread. First it’s important to understand that there are likely individuals who inherently spread more virus than the average person or there are at least circumstances that facilitate greater spread. A study by Asadi S. et al. in 2019 showed that the louder the voice, the greater the aerosol emissions. This is likely also true whenever forceful exhalation occurs. With activities like singing or vigorous exercise there comes the possibility that some individuals may be considered super-emitters who spread a much greater amount of virus-containing aerosols than typical individuals in normal situations. In this case the symptomatic choir member’s singing may have made them a super-emitter. On top of that, prolonged exposure in an enclosed space with little to no social distancing was an additional setup for aggressive viral spread through a large group; this is know as a superspreading event (SSE). SSEs are important public health concerns and have been documented in many pandemics. In a COVID-19 SSE, an infected individual can spread the virus to far more than the usual 2-3 people a typical person with SARS-CoV-2 does. In the Washington SSE for instance, the symptomatic choir member likely passed the virus on to dozens of people. SSEs are more likely to occur during gatherings at churches, concerts, sporting events, birthdays, funerals and at gyms or fitness centers. In each case we see the potential for a dangerous combination of people with loud voices or heavy breathing (super-emitters) coming together with large groups of people in enclosed spaces with less than optimal social distancing to create SSEs.
This report highlights the logistical challenges with large-scale reopening of society and businesses in the era of COVID-19, particularly for the highest risk sites. When venues such as those listed above do open, great care must be taken by both organizers of the venue and by visitors to the venue to reduce the risk of SSEs. Even with substantial attention and effort, it remains to be seen whether high-risk venues will be able to convince skittish visitors or members that it is safe to return as long as the virus is present in the community or until an effective vaccine is available.
COVID-19 death counts and accusations that they have been inflated is a topic I’ve avoided writing about because it’s politically charged. When something becomes political these days it moves away from the realm of science and into the realm of dogma, or quasi-religion. That’s why I shun politics. How do you rationally and logically discuss something that contradicts an almost religiously-held political belief? It’s like trying to convince someone that your religion is far superior to theirs and that all their theological ideas and canon are wrong. No good can come from it. This is the state of politics in America. In spite of this and against my better judgement I’m going to tackle the highly politicized issue of death counts because it’s that important.
Much of this started when Dr. Scott Jensen, who also happens to be a Republican State Senator in Minnesota, claimed on Fox News that doctors were being encouraged by CDC death certificate guidelines to list COVID-19 as a diagnosis even when there’s no clear evidence of COVID-19 infection. He went on to suggest that there was a financial motivation to list COVID-19 as a diagnosis because Medicare pays $13,000 for a COVID-19 and $39,000 if that same patient is placed on a ventilator. He also stated that doctors have a different approach when caring for patients with influenza. He used a hypothetical case of a patient with influenza who died during the course of the illness with a pneumonia as well. For him that death would be due to respiratory failure and pneumonia.
Jensen gave a hypothetical example of a patient who died while suffering from influenza. If the patient was elderly and had symptoms like fever and cough a few days before passing away, the doctor explained, he would have listed “respiratory arrest” as the primary cause of death.
“I’ve never been encouraged to [notate ‘influenza’],” he said. “I would probably write ‘respiratory arrest’ to be the top line, and the underlying cause of this disease would be pneumonia … I might well put emphysema or congestive heart failure, but I would never put influenza down as the underlying cause of death and yet that’s what we are being asked to do here.”
Dr. Scott Jensen/Fox News
Dr. Jensen and others have also called into question a CARES Act provision that pays hospitals a 20% bump over Medicare payments for patients with COVID-19. With financial incentives like this the clear implication is that doctors and hospitals are cooking the books, in effect, to unethically profit off of the crisis. There also seems to be a growing sentiment that above and beyond financial interests, that COVID-19 deaths are inflated in order to damage the President and increase the likelihood that he will lose the general election in November.
There’s a lot to unpack here but I’ll do my best. As always, I’m going to do my best to steer clear of politics and just try to address the accusations. For me, the most important reason to answer the allegations because of the damage they unfairly do to the public’s trust of doctors, hospitals and public health system. I’ll briefly discuss Dr. Jensen’s claims and why they don’t make sense to me. Ultimately you may choose to believe him over me but know that I don’t have a financial interest in COVID-19. On the contrary, as long as this crisis disrupts the economy my family is taking a financial hit like so many other American households. Life will unquestionably be better for me when this is over; I have no desire to make it seem worse than it is or drag it out longer than needed. I do have a great desire to help people understand how truly dangerous this virus is which is a different thing altogether. After I address Dr. Jensen, I will provide some data that I think shows pretty clearly that numbers aren’t exaggerated, in all likelihood COVID-19 deaths are undercounted.
Let’s take a look at the claim that hospitals get $13,000 for a COVID-19 admission and $39,000 for ventilation of a patient with the same diagnosis. These numbers are pretty close to the truth but what Dr. Jensen didn’t mention is that they are taken from the same diagnosis-related group (DRG) that covers other similar respiratory conditions. The Kaiser Family Foundation found that “average Medicare payment for respiratory infections and inflammations with major comorbidities or complications in 2017, which was $13,297.” They also found that “the average Medicare payment for a respiratory system diagnosis with ventilator support for greater than 96 hours…was $40,218.” So the base payment for hospitalization and/or ventilation for COVID-19 is actually pretty much identical to the payment for similar respiratory conditions. Well, what about the 20% bump you might ask? It is definitely true that this bump exists; it is part of the CARES Act that Congress passed and the President signed to help get the country through the crisis. The 20% bump is designed to help hospitals cover the added costs of caring for COVID-19 patients including personal protective equipment, isolation and disinfecting costs, and in particular the cost of caring for the uninsured. By paying a bit more for every Medicare patient, hospitals are better able to handle the added costs of caring for patients who have no insurance and likely will never be able to fully pay for their care assuming they survive to try.
As far as Dr. Jensen’s accusation of pressure to list COVID-19 on death certificates I’d also argue that the CDC’s guidance on certifying COVID-19 deaths is not unreasonable. This is based on my experience as a physician and public health doctor during the crisis. I definitely don’t think that this is resulting in a statistically significant over-counting of COVID-19 but more on that later in the post. Here’s the CDC’s exact wording.
In cases where a definite diagnosis of COVID-19 cannot be made, but it is suspected or likely (e.g., the circumstances are compelling within a reasonable degree of certainty), it is acceptable to report COVID–19 on a death certificate as “probable” or “presumed.” in these instances, certifiers should use their best clinical judgement in determining if a COVID–19 infection was likely. However, please note that testing for COVID–19 should be conducted whenever possible.
Guidance for Certifying Deaths Due to Coronavirus Disease 2019 (COVID–19)
You don’t have to believe me on this but this practice is not unusual for certification of death. There has never been a cookbook method of listing causes of death. For patients with infectious diseases, high suspicion based on clinical presentation and exposure history can inform decisions about cause of death even in the absence of laboratory tests. I fully disagree with Dr. Jensen on one of his points. He suggested in his Fox News interview that he never codes a patient who has tested positive for influenza as an influenza death if the patient has pneumonia. He reports he would list that death as respiratory failure and pneumonia. I do not believe that is the practice of the majority of US physicians nor do I believe it is appropriate. For patients such as this, the acute illness with influenza, should at least be included as a secondary diagnosis as it certainly contributed to the patient’s death.
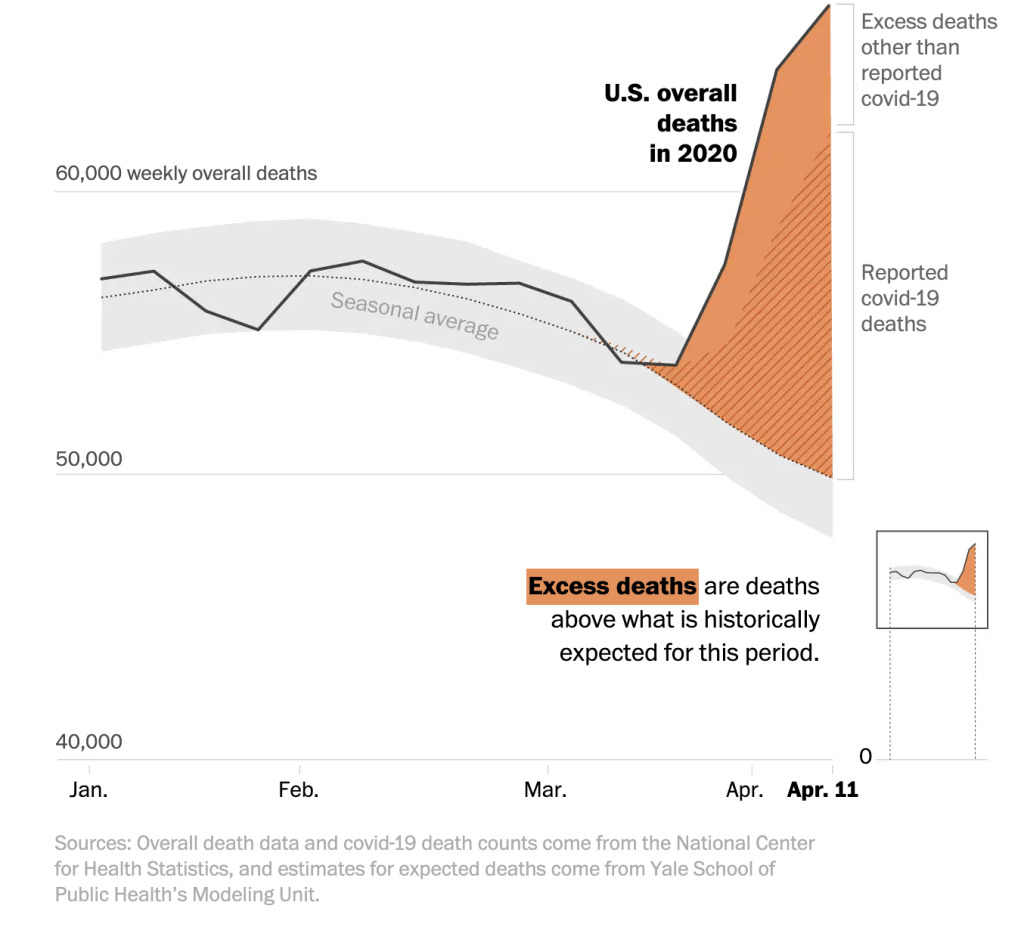
So enough about Dr. Jensen. Let’s take a look at the data that to me shows that deaths are indeed real and not over-counted. The data shows they are actually significantly undercounted. The New York Times has been tracking year to year differences in deaths in seven states with some interesting results. When compared to the previous five years New York City for instance had 225% more deaths (11,900) this year between March 8 and April 11 than the same period for the last five years–no year came anywhere close. The rest of New York had 42% (4200) more deaths than previous years and New Jersey had 72% (5200) more. Other states showed the same trend: Michigan had 21% (2000), Illinois came in at 13% (1400) and Massachusetts was higher by 20% (1200). Where did these deaths come from if not COVID-19? Did we suddenly have large aberrant spike in trauma deaths or cardiac deaths or cancer deaths in multiple states this spring? I think it would test the bounds of credulity to suggest this is the case. The truth is, I think, simpler; this spring we were hit with a dangerous virus that can hide in seemingly healthy people and spread easily to close contacts causing a disturbingly common severe respiratory distress syndrome with or without multisystem organ failure.
Excess U.S. deaths Hit Estimated 37,100 in Pandemic’s Early Days, Far More than Previously Known/Washington Post
If that’s not enough, consider this. In all of the states I mentioned and that the Times followed, the number of confirmed COVID-19 deaths is lower than the total number of extra deaths. In other words, COVID-19 deaths were undercounted in NYC (1700), NJ (3000), NY State (1700), Michigan (600), Illinois (700) and Massachusetts (500) over that time period. The Washington Post looked at the early days of the pandemic and measured excess deaths across the country and found similar data–we had far more deaths than normal years and there’s solid evidence that we didn’t catch all of the COVID-19 cases.
I can understand that some Americans may have doubts about COVID-19 numbers, particularly when physicians step forward to suggest that something fishy is going on. It’s reasonable to feel this way and it’s important to hear out critics of any system. I don’t believe Dr. Jensen is lying and I don’t believe he is a bad person. He’s undoubtedly an excellent, dedicated doctor to the patients in his practice. I think just think he’s wrong about this and in my mind the data confirms this.
Vaccines For Children (VFC) study showing week to week differences in vaccines ordered from the VFC for non-influenza routine vaccines and measles containing vaccines and week to week comparison of administered measles-containing vaccine.
Santoli JM, Lindley MC, DeSilva MB, et al. Effects of the COVID-19 Pandemic on Routine Pediatric Vaccine Ordering and Administration — United States, 2020. MMWR Morb Mortal Wkly Rep. ePub: 8 May 2020. DOI: http://dx.doi.org/10.15585/mmwr.mm6919e2external icon
A study by Santoli et al. is showing that there has been a sharp drop in ordering of routine non-influenza and measles-containing vaccines since the national state of emergency was declared over COVID-19. There was also a very worrisome drop in the administration of measles-containing vaccine. Parental concerns about COVID-19 have produced a sharp drop-off in routine well check exams leaving many pediatric offices nearly empty. The drop-off in measles vaccination has been much greater for kids over two years of age but both age groups have been significantly impacted. The trend is slowly reversing but the risk of a pediatric disease outbreak is growing every day as vaccines become more and more delayed. Measles vaccination rates need to be maintained at around 95 percent to prevent outbreaks so whenever a significant portion of the pediatric population is delayed with their shots, measles could take hold and spread. Rates in the US are already worrisomely low coming in at 91.5% with some states below 90%. A measles outbreak on top of our current COVID-19 pandemic could be devastating to kids and cause further strain on a critically ill economy.
Measles/CDC
Pediatric offices have made major changes to assuage parental fears of contracting SARS-CoV-2. Most practices offer telehealth visits for the physician portion of the well-child visit. When in-person visits are required, many offices now have blocked-off the morning for well patients with comprehensive cleaning between visits and before the sick visits in the afternoon. Many offices have closed waiting rooms and instead call families in from their cars when it’s time for their appointment. While protecting against COVID-19 is important for families, it’s vital that we quickly bump up our vaccination rates and provide catch-up vaccination for those behind or we risk preventable outbreaks on top of a pandemic. Contact your child’s pediatrician or pediatric care provider to see how you can get your child’s well check and vaccines taken care of so that they’re fully protected.
Understanding the difference in deaths due to flu and deaths due to COVID-19 requires an understanding of how the CDC calculates flu deaths annually. Flu is dramatically underreported each year. Some of the reasons for that undercounting include a fairly narrow window for detecting the virus through testing (i.e. even if a patient has flu, the test may not detect the virus if the test is done outside of the window for testing), the fact that older patients who die from flu may never even be tested, and even if tested and positive, death certificates may list associated pneumonia instead of flu as the cause of death.
In order to adjust for this gross undercounting, the CDC uses algorithms based of of actual positives recorded each year in the FluSurv-Net influenza surveillance system to retroactively estimate total numbers of deaths from flu. They start by adjusting the influenza confirmed test-positive hospital deaths to account for under-detection (reasons stated above like false negatives) to arrive at an estimate of influenza hospital deaths. Because not everyone with influenza dies in the hospital, they then look at death certificates to reach a determination of deaths due to influenza that occurred outside of the hospital. They assess multiple causes of death like pneumonia and other respiratory causes and compare those ratios with the actual deaths related to influenza from the FluSurv-Net surveillance system to reach a total disease burden and estimated annual deaths. This is all done retrospectively so data for the current year is generally not available for some time.
This method of determining influenza burden has clear benefits. It’s important for Americans and healthcare workers to understand the cost in lost lives from influenza each year. Because virtually all of us have someone we love who is considered high risk for death from influenza, maintaining high vaccination rates are critical to preventing dramatic increases in deaths. But in a year with COVID-19, this estimated death toll from influenza is problematic and has led some pundits, elected officials and millions of google-trained virologists and epidemiologists to erroneously conclude that COVID-19 is no worse than flu and that a shutdown was/is unnecessary. This, however, is not a valid comparison as no similar algorithm for missed COVID-19 cases is in play. Only actual test-positive COVID-19 cases are counted with a few very specific exceptions.
In an interesting opinion piece in Scientific American, ER physician Dr. Jeremy Faust of Brigham and Women’s and Harvard Medical School suggested that this false comparison and the damage it does to understanding the scope and severity of COVID-19 may necessitate that the CDC move to reporting only test-positive cases of influenza. When Dr. Faust compared the confirmed flu deaths from each of the last seven years with the confirmed COVID-19 deaths of 2020, a clearer picture of COVID-19’s severity became clear.
This year alone, confirmed COVID-19 deaths are nearly 10 times higher than confirmed flu deaths. Dr. Faust also looked deaths for just one week of COVID-19 and compared those deaths to the previous seven seasons of flu.
If we compare, for instance, the number of people who died in the United States from COVID-19 in the second full week of April to the number of people who died from influenza during the worst week of the past seven flu seasons (as reported to the CDC), we find that the novel coronavirus killed between 9.5 and 44 times more people than seasonal flu. In other words, the coronavirus is not anything like the flu: It is much, much worse.
Jeremy Faust, MD/Scientific American
Changing the way we report flu deaths by listing only test-confirmed cases could have serious adverse consequences when it comes to influenza vaccination rates. If Americans see the smaller totals and think that confirmed flu cases are an accurate representation of flu burden they may be less likely to vaccinate. That could have a devastating effect on protecting vulnerable populations from flu in future seasons. Still, during this COVID-19 crisis the apples to oranges comparison of COVID-19 deaths to annual flu deaths has led many Americans to erroneously and dangerously conclude that COVID-19 is no worse than flu. It’s vital that Americans understand the substantial difference and maintain vigilance against COVID-19, evidenced by the extremely unwise increase in mass anti-lockdown protests popping up around the country. As Dr. Faust suggests, the CDC should consider modifying its flu reporting to at least include data for test-confirmed cases with their algorithmic estimates of influenza burden.