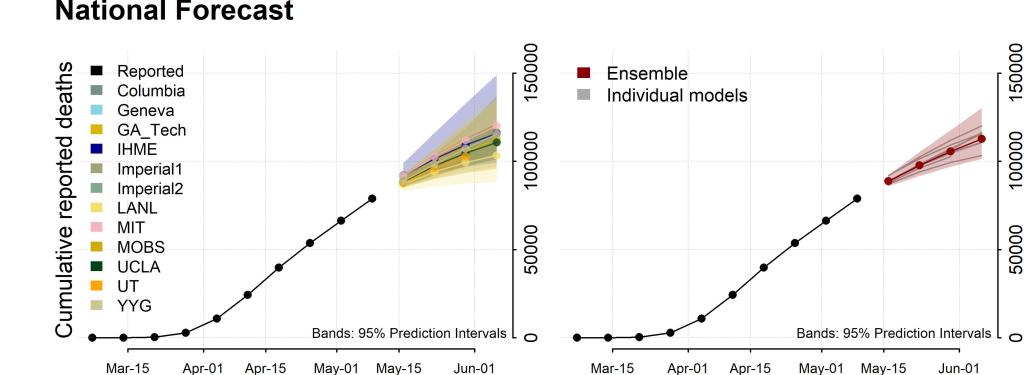
- Predictive models for US deaths are beginning to coalesce around a projection of 110,000-115,000 deaths by June 6. By August 1st we’re looking at around 180,000 deaths.
- Youyang Gu has used the data from his incredibly accurate COVID-19 model to calculate Infection Fatality Rate (IFR) of about 1% for the virus. The IFR is difficult to know during a pandemic and may not be fully fleshed out for years. The IFR is the percentage of people who die out of the total number of people who are infected (whether or not they are test-confirmed or symptomatic). Because we won’t know this data for some time the IFR is elusive during a pandemic. What Gu has done is use the accuracy of his model as a starting point and reference and then calculated curves based on IFRs from 0.2-1.5%. The IFRs that had the smallest variance from his curve came in around 1% (0.9-1.2). This is similar to other estimations of IFR from New York data which come in at around 0.91%. It would appear from these estimates (and make no mistake, they are estimates) that COVID-19 is approximately 10 times more deadly than flu–basically the estimate Dr. Fauci gave to Congress during his testimony. The Case Fatality Rate (CFR) is much higher than the IFR because it is a measure of deaths out of the total number of confirmed cases (e.g. only those cases that have tested positive for the disease and not the untested or the asymptomatic) and the mortality rate is lower because it is a measure of deaths as a part of the total population (i.e how many people died from a disease out of the entire population of the US). The term “mortality” is often used familiarly to describe the IFR and sometimes the CFR but it is important to know that they are all actually different measures of death due to disease. It should be noted that to focus solely on deaths in a pandemic is a myopic approach and doing so does not reveal a fully accurate picture of disease severity.
- Cases in Orange County are increasing week to week (441-664-787) following the crowds converging on the beaches on April 25th and 26th. It’s concerning but at this point it’s nothing more than correlation; it’s not known if the crowding caused these increases. If a link exists, contact tracing may reveal it. The increase in cases could be related to an increase in testing as well as OC has been lagging behind other counties in the region. The increases in recent weeks could also merely be a statistical aberration and numbers could soon fall. It will be important to follow OC’s numbers either way as it has been a gathering point for people seeking the sun and, in some communities, for people protesting stay-at-home orders.
